FACT : Approaching a major Red Band Resistance FACT : Approaching a major Red Band Resistance .
Important Level to watch for is 1112 .
( Not a Buy / Sell Recommendation
Do your own due diligence ,Market is subject to risks, This is my own view and for learning only .)
FACT trade ideas

FACT : Sitting at the Major Red Band Resistance
FACT : Sitting at the Major Red Band Resistance
MACD is also Negative
( Not a Buy / Sell Recommendation
Do your own due diligence ,Market is subject to risks, This is my own view and for learning only .)
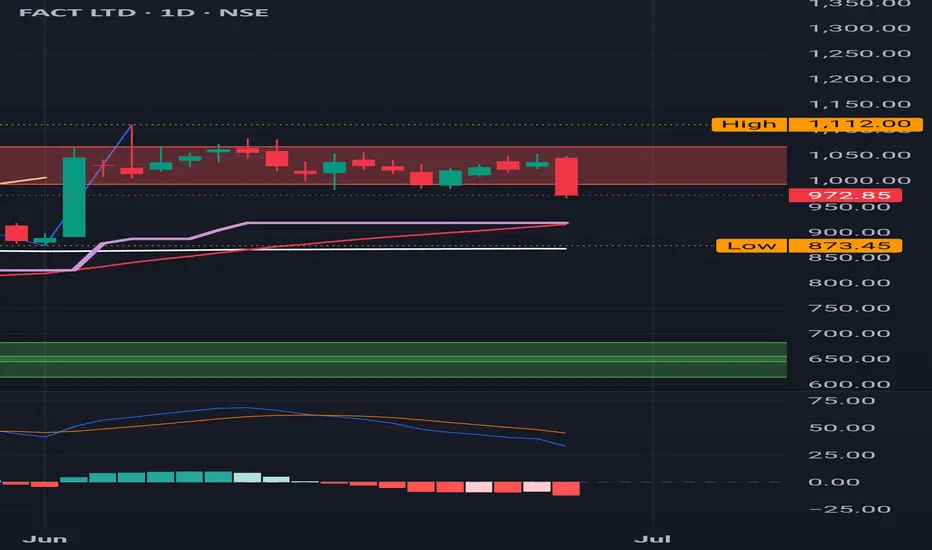
FACT : Sitting at the Red Band resistance
FACT : Sitting at the Red Band Resistance
Got a pull back from 1112 which will be an important level to test moving forward..
( Not a Buy / Sell Recommendation
Do your own due diligence ,Market is subject to risks, This is my own view and for learning only .)

FACT : Fantastic Run after a Buy Signal ,now at a resistance FACT : Fantastic Rally after a Buy Signal ,now sitting at a major Red Band Resistance
( Not a Buy / Sell Recommendation
Do your own due diligence ,Market is subject to risks, This is my own view and for learning only .)

FACT LTD - Buy idea- Cup and handle pattern in 1hr TF.
- Targets 860, 900, 1050
- Stop loss: close the trade if stock closes below the trend line.

FACT : Buy triggered near the resistance of 760 FACT : Buy triggered near the resistance level of 760 . It went up all the way to 798 but couldn't sustain and came back to the resistance level of 760 .
So if resistance 1 (R1) is 760 then
R2 could be 800 .
MACD is fine
Still under 200 SMA .
( Not a Buy / Sell Recommendation
Do your own due diligence ,Market is subject to risks, This is my own view and for learning only .)

POV : FACT : Another Wave of ProfitPOV : FACT : Another Wave of Profit
Chart Reading:
1. Facts of FACT were in a downtrend reflected by both trend lines (High and closed based).
2. Support :
Took Support at
2.A) Previous Resistant & Breakout Zone
2.B) Fib Level 0.618
2.C) 200 SMA
3. Form neat Adam and Eve at the Bottom.
4. Closing Basis Trend Line Breach on 28th Nov.
5. High Basis Trend Line Breach on 29th Nov.
6. Huge Volume on 29th Nov. which gives me additional confirmation of breakout.
Concern :
1. Huge Range Expansion
2. Cover Almost 5 Fractals high in one candle. (although it's a bullish sign but we get stop loss gets far)
Action Plan :
Either Wait for Pullback or Go for Breakout.
Both Entry levels and targets are shared here for your educational purposes.
you have to decide which kind of trader you are.
I am attempting both: if breakout first then go with half qty and rest of add at either POA or Pullback.
Disclaimer :
For educational purposes only. This is not financial advice. Please consult a professional before making financial decisions.
#NiVYAMi


FACT(NSE) Stock - Applying Bullish Breaker Concept on TradingTrading is simple!
All you need to know is Premium / Discount Arrays to understand market dynamics.
Choose the Higher Time Frame (HTF) PD array and trade Lower Time Frame (LTF) PD array.
Time Frame Alignment
HTF - H4
LTF - M15
HTF PD ARRAY - Bullish Breaker
LTF PD Array - Bullish Breaker
Higher Time Frame gives you market direction.
Lower Time Frame gives you entry opportunity

FACT S/R Support and Resistance Levels:
Support Levels: These are price points (green line/shade) where a downward trend may be halted due to a concentration of buying interest. Imagine them as a safety net where buyers step in, preventing further decline.
Resistance Levels: Conversely, resistance levels (red line/shade) are where upward trends might stall due to increased selling interest. They act like a ceiling where sellers come in to push prices down.
Breakouts:
Bullish Breakout: When the price moves above resistance, it often indicates strong buying interest and the potential for a continued uptrend. Traders may view this as a signal to buy or hold.
Bearish Breakout: When the price falls below support, it can signal strong selling interest and the potential for a continued downtrend. Traders might see this as a cue to sell or avoid buying.
20 EMA (Exponential Moving Average):
Above 20 EMA(50 EMA): If the stock price is above the 20 EMA, it suggests a potential uptrend or bullish momentum.
Below 20 EMA: If the stock price is below the 20 EMA, it indicates a potential downtrend or bearish momentum.
Trendline: A trendline is a straight line drawn on a chart to represent the general direction of a data point set.
Uptrend Line: Drawn by connecting the lows in an upward trend. Indicates that the price is moving higher over time. Acts as a support level, where prices tend to bounce upward.
Downtrend Line: Drawn by connecting the highs in a downward trend. Indicates that the price is moving lower over time. It acts as a resistance level, where prices tend to drop.
RSI: RSI readings greater than the 70 level are overbought territory, and RSI readings lower than the 30 level are considered oversold territory.
Combining RSI with Support and Resistance:
Support Level: This is a price level where a stock tends to find buying interest, preventing it from falling further. If RSI is showing an oversold condition (below 30) and the price is near or at a strong support level, it could be a good buy signal.
Resistance Level: This is a price level where a stock tends to find selling interest, preventing it from rising further. If RSI is showing an overbought condition (above 70) and the price is near or at a strong resistance level, it could be a signal to sell or short the asset.
Disclaimer:
I am not a SEBI registered. The information provided here is for learning purposes only and should not be interpreted as financial advice. Consider the broader market context and consult with a qualified financial advisor before making investment decisions.

FACT- uptrend and price contracting1. Good DNA(12-25%)
2. Strong uptrend
3. Volume dry and price contraction
4. Taking support near previous High.

Entered at 993, SL4%Stage 2; Coming out of base.
Stop loss 4%
After a long run, price consolidated and formed base. Today it broke out with high volume.

FACT GIVES BRAKEOUT ON DAILY CHARTNSE:FACT
FACT GIVES BRAKEOUT ON DAILY CHART.
I am buying some quantity of FACT on price 1050-1100
i will follow SL of 940
and i will set my target on 1370+
i think in next 1 month i will get my targets.
risk reward ratio is 1: 2 and
my return on capital will be 25%+


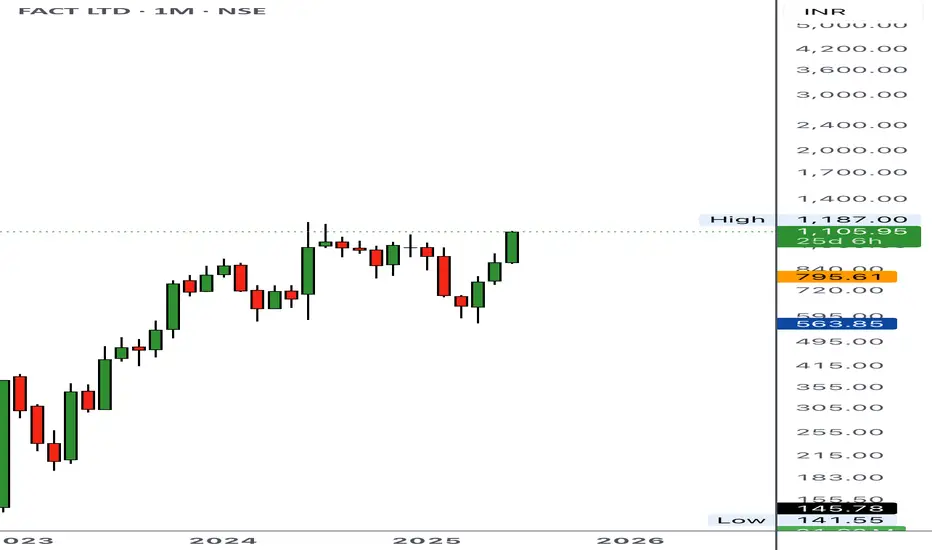
FACT looks good for 1150++After a bull run stock gone ina sideway
now seems coming out of conaolidation
stoploss can set 970
1160 ..1200 targets
agro chemical theme!
Fertilizers & Chemicals Travancore Ltd (FACT), incorporated in the year 1943, is the first large-scale fertiliser plant in India at Udyogamandal, Kochi, Kerala. The company is engaged in the manufacturing and selling of fertilizers, its by-products and Caprolactam. It is under the administrative control of the Department of Fertilizers, Ministry of Chemicals & Fertilizers, Government of India.

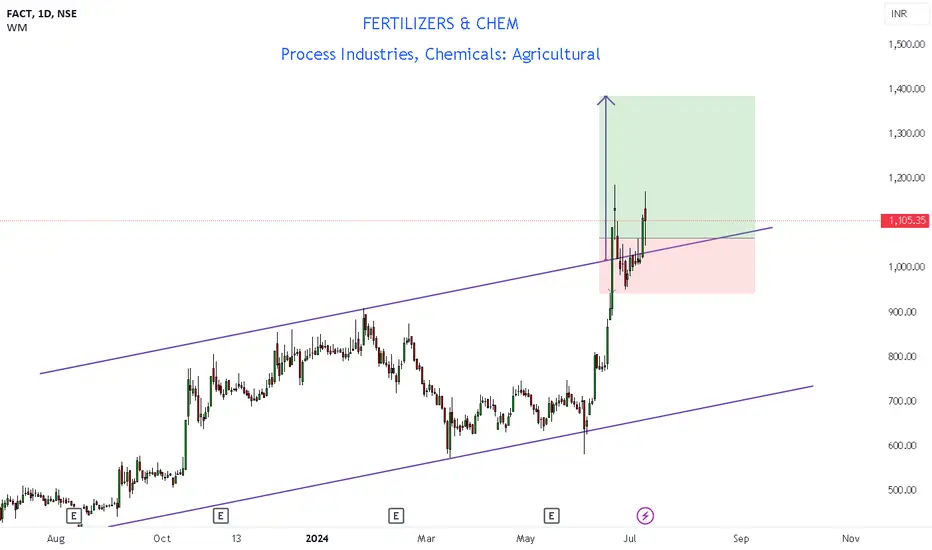
FACT will goes upto 1225**Recommendation for FACT**
- **Entry**: 880 (Current Market Price)
- **Stop Loss**: 765
- **Target**: 1225 and beyond
### Summary
- **Risk/Reward Ratio**: Approximately 3:1
- **Position Sizing**: Calculate based on your risk tolerance
- **Monitoring**: Regularly review and adjust as needed
Happy trading!

FACT Positional LongTermBuy FACT above 855
for the Target of 1371
SL 661
Strategy : SBO + RSI > 60 + EMA above 20 & 50
Duration few Months

MyPOV @ Furtilizers & Chem - FACTMyPOV @ FACT
Check out my #FACT analysis on @TradingView:
For educational purposes only. Not financial advice. Consult a professional before making financial decisions. #Disclaimer
#NiVYAMi

🚀 Unveiling Trade Opportunities: FACT Fertilizers & ChemicalsWe're diving into the charts of FACT Fertilizers and Chemicals to uncover potential trade setups.
Current Situation 📊:
LTF Analysis: Currently, FACT is nestled in the 75-min demand zone, specifically the Rally 2 Base Rally (R2BR) zone.
ITF Overview: The Intermediate Time Frame (ITF) shows a clear uptrend. The price is comfortably trading at the daily EMA20
HTF Insights: Zooming out to the Higher Time Frame (HTF), the weekly chart indicates a strong uptrend, and there's a clear path upside with no resistance in sight.
Enter at the 75-min current demand zone, Risk-to-Reward Ratio: Aim for a lucrative 1:3.
🌟Thank you for your support! Your likes & comments. If you want to give any feedback then you can give in the comment section🌟
Trade with confidence, and let your profits run like a river. Embrace the journey!
Disclaimer 🚨:
This analysis is for educational purposes only. We aren't SEBI registered analysts. Trade responsibly.

FERTILIZERS&CHEM. STOCK GIVING A UP MOVE .NSE:FACT
FERTILIZERS&CHEM. STOCK GIVING A UP MOVE .
entry price - 726
sl price - 687
target price - 804
ENTRY DATE - 29-11-2023
EXIT DATE - PENDING .

Rocket 🚀 2 #baapofbreakoutEntry CMP
Stop 6 %
Breakout trading implementation:
1. **Identifying New Trends:** Breakout trading helps traders identify the beginning of new trends by focusing on price levels where an asset breaks out of its historical trading range.
2. **Volatility Indicator:** Breakouts often occur when there's increased volatility in the market. Monitoring breakouts can provide insights into shifts in market sentiment and potential price movements.
3. **Entry Points:** Breakout points serve as potential entry points for traders looking to ride the momentum of a newly established trend. Buying on a breakout can capture the early stages of a price movement.
4. **Confirmation of Strength:** Successful breakouts indicate the strength of a trend. If an asset breaks out with high volume and follows through with sustained price movement, it suggests a strong trend in that direction.
5. **Avoiding False Signals:** Breakout strategies often include using indicators or confirmation signals to avoid false breakouts. This can enhance the accuracy of trade decisions.
6. **Defined Risk and Reward:** Breakout trading allows for setting clear stop-loss levels below the breakout point, which helps manage risk. Traders can also calculate potential profits based on the distance between the breakout point and a projected target.
7. **Adaptable to Various Markets:** Breakout trading can be applied to various markets, including stocks, forex, commodities, and cryptocurrencies. The concept remains consistent across different assets.
8. **Flexibility:** Traders can adapt breakout strategies to their preferred timeframes, whether they are day traders, swing traders, or long-term investors.
9. **Liquidity Opportunities:** Breakout points are often associated with increased trading volume, which can provide better liquidity for executing trades.
10. **Risk vs. Reward Assessment:** Traders can evaluate the potential risk of a trade (stop-loss) against the potential reward (target price), aiding in decision-making and portfolio management.
11. **Psychological Advantage:** Successful breakout trades can boost a trader's confidence and discipline, reinforcing the effectiveness of their strategy.
12. **Market Events:** Breakouts can occur around significant market events such as earnings reports, economic data releases, or geopolitical developments, offering traders opportunities to capitalize on sudden price movements.
Remember, while breakout trading offers potential advantages, it also carries risks. False breakouts and market reversals can lead to losses. Successful implementation requires a solid understanding of technical analysis, risk management, and the ability to adapt to changing market conditions.
