FCL BUY FCL - Finotex chemicals Up view
Trade Reason :
1- Weekly support
2- Trendline 4th Touch
3- Day Trend reversal
Entry - 373 Rs
Target - 428 Rs
Stoploss - 330 Rs
Thank you ..
FCL trade ideas

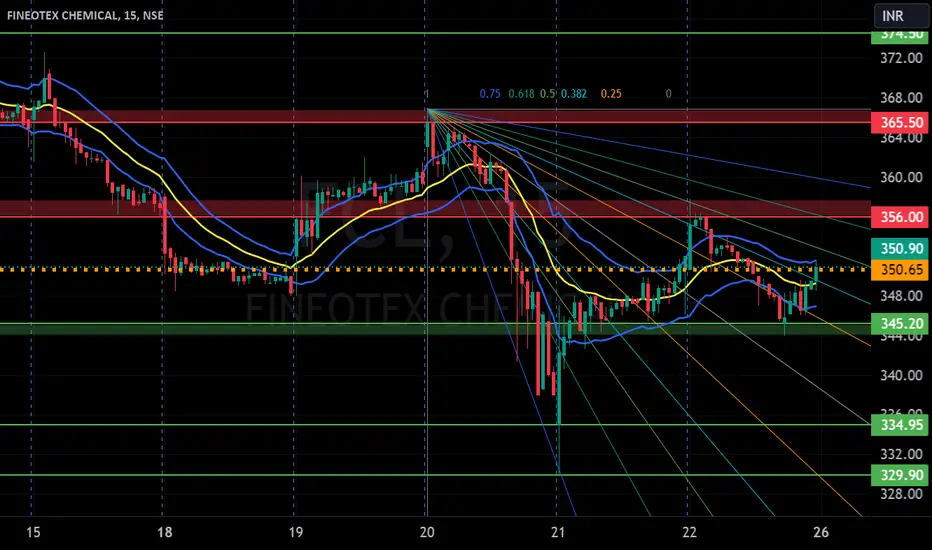
FINEOTEX CHEMICAL S/RSupport and Resistance Levels: In technical analysis, support and resistance levels are significant price levels where buying or selling interest tends to be strong. They are identified based on previous price levels where the price has shown a tendency to reverse or find support.
Support levels are represented by the green line and green shade, indicating areas where buying interest may emerge to prevent further price decline.
Resistance levels are represented by the red line and red shade, indicating areas where selling pressure may arise to prevent further price increases. Traders often consider these levels as potential buying or selling opportunities.
Breakouts: Breakouts occur when the price convincingly moves above a resistance level (red shade) or below a support level (green shade). A bullish breakout above resistance suggests the potential for further price increases, while a bearish breakout below support suggests the potential for further price declines. Traders pay attention to these breakout signals as they may indicate the start of a new trend or significant price movement.
Disclosure: I am not SEBI registered. The information provided here is for learning purposes only and should not be interpreted as financial advice. It is important to consult with a qualified financial advisor before making any investment decisions. Tweets neither advice nor endorsement.

FCL Limited Looks ready to move.FCL is looks like ready to move up. It's taking support on 20 MA.
Enter with a stop loss of 5%. Good small-cap Company fundamental is solid.

FCL Long PositionalBuy FCL above 380
Target of 404-447-474-500-550-600
SL 297
Strategy : SBO + RSI > 60 + EMA above 20 & 50
Duration few weeks to months
Please consult your financial advisor before investing
All research for educational purposes only.
Stock is ready to cross past barriers with good volumes

Accumulate at 400 levels400 levels are the good buying area. Once can start buying few quantities every month. Fibonacci levels and predicted price movements are as marked in chart. Next target would be 600.

Perfect breakout candidate with potential upside movement..This stock is Chemical sector has given a clear breakout on weekly Time frame with good volume sprout..

FCLStock name = Fineotex Chemical Limited.
Weekly chart setup
Chart is self explanatory. Levels of breakout, possible up-moves (where stock may find resistances) and support (close below which, setup will be invalidated) are clearly defined.
Master Score - B
Disclaimer: This is for demonstration and educational purpose only. this is not buying and selling recommendations. I am not SEBI registered. please consult your financial advisor before taking any trade.

FCL: Technical Triumph - Monthly Breakout Signals Bullish MoveFCL (Favorable Corporation Limited) is currently showcasing an impressive technical breakthrough on the monthly time frame, setting the stage for a compelling bullish trade opportunity. This breakout, coupled with robust trading volumes, highlights a significant shift in market dynamics, capturing the attention of traders who rely on technical indicators.
Key Technical Indicators:
Monthly Breakout:
Chart Analysis: FCL's monthly charts reveal a decisive breakout, suggesting a noteworthy shift in the stock's trajectory. The breakout signifies the potential for an extended bullish trend, offering traders an enticing prospect for capitalizing on positive momentum.
Volume Confirmation:
Strong Trading Volumes: The breakout is complemented by strong trading volumes, indicating substantial market participation. Volume confirmation adds credibility to the bullish move, reinforcing the potential sustainability of the upward momentum.
Price Action Patterns:
Bullish Patterns: Detailed analysis of price action patterns on the monthly charts may reveal bullish formations, further strengthening the case for a favorable trade on technical grounds.
Supporting Technical Indicators:
Positive Signals: Additional technical indicators, such as moving averages, RSI (Relative Strength Index), or MACD (Moving Average Convergence Divergence), may provide positive signals, aligning with the overall bullish sentiment.
Trading Strategy Considerations:
Bullish Bias:
Positioning: Traders adopting a bullish bias may find the breakout in FCL an opportune moment to establish or add to long positions.
Risk Management:
Protective Measures: Employing effective risk management strategies, including setting stop-loss levels and defining risk-reward ratios, is crucial to navigate potential fluctuations in the market.
Confirmation from Other Time Frames:
Comprehensive Analysis: Traders may benefit from a comprehensive analysis, considering confirmations from multiple time frames to enhance the robustness of their trading decisions.
As traders consider FCL for a bullish trade based on technical indicators, it's essential to exercise due diligence. This includes staying informed about market conditions, continually monitoring price action, and remaining adaptable to emerging trends. While technical analysis provides valuable insights, combining it with a thorough understanding of fundamental factors can contribute to more informed and well-rounded trading decisions. Seeking advice from financial professionals or advisors is recommended for personalized guidance in navigating the dynamics of FCL's breakout on the monthly time frame.

FCL S/R for 26/12/23Support and Resistance Levels:
Based on the price action, you have to identify two significant levels: the red line acting as resistance and the green line acting as support. Additionally, there have marked red and green shades to represent resistance and support zones, respectively.
Support: The green line and green shade represent support levels. These levels are where the price tends to find buying interest, preventing it from falling further. Traders can consider these levels as potential buying opportunities.
Resistance: The red line and red shade represent resistance levels. These levels are where the price tends to encounter selling pressure, preventing it from rising further. Traders can consider these levels as potential selling opportunities.
Breakouts: If the price breaks above the resistance zone (red shade) convincingly, it may indicate a bullish breakout, and the price could move higher to the next resistance level. On the other hand, if the price breaks below the support zone (green shade) convincingly, it may indicate a bearish breakout, and the price could move lower to the next support level.
Keltner Channel:
The Keltner Channel is a technical indicator that uses an exponential moving average (EMA) to create an upper and lower channel around the price action. Traders can use this channel to identify potential long and short positions.
Long Position: If the price is above the upper line of the Keltner Channel, it may indicate a potential long opportunity, as it suggests the price is trading above the average range and might continue in an upward trend.
Short Position: If the price is below the lower line of the Keltner Channel, it may indicate a potential short opportunity, as it suggests the price is trading below the average range and might continue in a downward trend.
Disclosure: I am not SEBI registered. I just wanted to let you know that the information provided here is for learning purposes only. Please consult your financial advisor before making any decisions. Tweets neither advice nor endorsement.
FCLThese are swing ideas which you can add your watchlist and analysis for yourself !
Keep on your radar!
This content only education purpose!
❗I am not sebi ragister❗

SWING TRADE IDEAFCL gave weekly resistance zone with a strong bullish candle with gud volume this can be look to play for swing by keeping the sl of this candles low by keeping a little buffer for the target of 1:2:3.

long setuplooking good chart
The company has shown a good profit growth of 69.00% for the Past 3 years.
The company has shown a good revenue growth of 31.88% for the Past 3 years.
Company has been maintaining healthy ROE of 21.64% over the past 3 years.
Company has been maintaining healthy ROCE of 27.47% over the past 3 years.
Company is virtually debt free.
The company has a high promoter holding of 65.03%.
The company has a strong degree of Operating leverage, Average Operating leverage stands at 111.78.

400+Stock is forming H&S on weekly chart. Look for target above 400.
Those who bought at the green support levels , will get double return.
New Entries at this point will yield only 20 to 40%. Don't expect more than that.

Fcl..next leg of bull runFcl is a chemical stock which gave good returns in the past. Cup and handle breakout ensures beginning of next bull run. However traders can keep sl below 290

FCL BREAKOUT ABOVE 320Chemical sector gaining momentum and this is my favourite stock, currently trading at the pe of 33, ROE-32.39%, market cap 3111cr, need to close above 320 then 350-380 possible

Fineotex Chemicals Ltd short term swing setupA nice Cup with Handle pattern formed as highlighted.
Better to enter after trendline breakout with increase in volume for more conviction.
Technical target is around 446.5 (46.97% ROI from CMP)
Stop Loss below 268.5 (1:4 R:R)
One of the best fundamentally sound chemical stocks to invest for long term.
ROCE 37.3 %
ROE 28.9 %
Debt to equity 0.02
Current ratio 3.58
Quick ratio 2.83
Piotroski score 9.00
Do your own due diligence before taking any action.
Peace!!

FCL - Bullish Swing ReversalNSE: SUNCLAYLTD is closing with a bullish swing reversal candle supported with volumes.
Today's volumes and candlestick formation indicates strong demand and stock should move to previous swing highs in the coming days.
The stock has been moving along the horizontal support for the past few days which is indicating demand.
One can look for a 8% to 13% gain on deployed capital in this swing trade.
The view is to be discarded in the event of the stock breaking previous swing low.
#NSEindia #Trading #StockMarketindia #Tradingview #SwingTrade

FCS long after breakout a round bottom pattern is visible on the daily and weekly chart of FCS ltd. Breakout is possible.
RSI indicator shows strength , as it goes above 50
MACD indiacator also shows the positiveness.
I am not a sebi register analyst. So do your own research before investing.

Cup and handle breakout. LongCup and handle breakout in FCL . One can take the long position as the retest also happened and under the strong support of 50% Fibonacci and 200 dma both coincides with price 280

FCL for swing tradingStock looks for Swing trading with good volume and price action. RSI intersection seen at upper levels.


Finotex chemical Ltd (fcl)After a multi bagger return in short term
Fcl looks good for a good upmove
Above 381
Sl 360
Tgt 400 412 441
Ask your financial advisor before taking any action based on my view
Only for educational purposes
