Finolex Cables: Unveiling the Bullish Momentum Beyond Resistancewww.tradingview.com
Current Market Overview
Finolex Cables Ltd. has exhibited significant price movements recently, indicating potential future trends. The stock is currently priced at 914.95, with notable highs and lows. Analyzing key technical indicators and historical data, we can formulate a well-rounded prediction.
Technical Indicators
Price Levels:
--------------
-> Support Levels: 800, 700
-> Resistance Levels: 1,090, 1,345.75, 1,577
Volume Profile:
------------------
Strong volume around 11,757,413 suggests significant interest and potential support at this level.
Break of Structure (BOS):
-----------------------------
Multiple BOS annotations indicate significant trend changes, highlighting key reversal points.
Order Blocks and D-Key Levels:
-------------------------------------
Order blocks (OB) and D-Key levels mark areas of high trading activity and potential reversal zones.
Historical Performance
The chart showcases several Break of Structure (BOS) points, signaling critical trend reversals. The recent price action around the 800 support level suggests a potential rebound, while resistance levels at 1,090, 1,345.75, and 1,577 indicate possible challenges ahead.
Future Projections
Based on the current analysis, we can outline three potential scenarios:
Bullish Scenario:
-------------------
-> Minimum Projection: 1,090 (+17.38%)
-> Average Projection: 1,345.75 (+47.08%)
-> Maximum Projection: 1,577 (+72.36%)
If the stock breaks above the 1,090 resistance level and sustains this momentum, it may target higher levels. This would require strong buying pressure and favorable market conditions.
Bearish Scenario:
---------------------
If the stock fails to break above 1,090 and instead breaks below the 800 support level, it could decline further towards 700. This would indicate continued bearish pressure and lack of buying interest.
Conclusion
-------------
The technical analysis suggests a potential bullish trend for Finolex Cables Ltd. The support levels around 800 and 700 provide a strong foundation, while the resistance levels at 1,090, 1,345.75, and 1,577 offer potential targets. Traders should monitor these levels closely and consider the projections when making trading decisions.
FINCABLES trade ideas

Finolex CablesBuy and add any dip till 1142 with Stop Loss 1088 & TGT 1 - 1531 & TGT 2 - 1684.
Retracement completed, now has good price increment with volume (weekly & daily).
Price 1337 can act as rejection.
I am not SEBI Registered.


FINOLEX CABLES LTD S/RSupport and Resistance Levels:
Support Levels: These are price points (green line/shade) where a downward trend may be halted due to a concentration of buying interest. Imagine them as a safety net where buyers step in, preventing further decline.
Resistance Levels: Conversely, resistance levels (red line/shade) are where upward trends might stall due to increased selling interest. They act like a ceiling where sellers come in to push prices down.
Breakouts:
Bullish Breakout: When the price moves above resistance, it often indicates strong buying interest and the potential for a continued uptrend. Traders may view this as a signal to buy or hold.
Bearish Breakout: When the price falls below support, it can signal strong selling interest and the potential for a continued downtrend. Traders might see this as a cue to sell or avoid buying.
MA Ribbon (EMA 20, EMA 50, EMA 100, EMA 200) :
Above EMA: If the stock price is above the EMA, it suggests a potential uptrend or bullish momentum.
Below EMA: If the stock price is below the EMA, it indicates a potential downtrend or bearish momentum.
Trendline: A trendline is a straight line drawn on a chart to represent the general direction of a data point set.
Uptrend Line: Drawn by connecting the lows in an upward trend. Indicates that the price is moving higher over time. Acts as a support level, where prices tend to bounce upward.
Downtrend Line: Drawn by connecting the highs in a downward trend. Indicates that the price is moving lower over time. It acts as a resistance level, where prices tend to drop.
Disclaimer:
I am not a SEBI registered. The information provided here is for learning purposes only and should not be interpreted as financial advice. Consider the broader market context and consult with a qualified financial advisor before making investment decisions.

FINCABLES NSE BULLISH FLAGFINCABLES has broken out of a Bullish Flag on DTF
Price is above 200EMA. Currently Price is below 21EMA is below 50 suggesting a Flat Trend
CAMS is trading above the 38.2%% FIBO Retracement Range
FINCABLES is currently consolidating in a Range, Enter when Range is broken on WTF.
SL below the consolidation Range @1360. enter at current price with 25% Quantity ADD 25% when price closes above @1495 in WTF ..Add progressively. at higher Close and 21EMA crosses 50EMA in DTF
KEEP Strict SL

Finolex Cables - Swing Long SetupEnter only when 15minute candle closes above the Entry Zone Price - 1559
Target with Risk to reward 1:2 is 1940
Stoploss only when 1 day candle closes below the price - 1369.15
Note: This is not any financial advice, this is for education purpose only.

$fincablesvwap from swing low
200 ema creeping up
range low liquidity
confluence of the above 3 is where this bubba should have its line in the sand
so on the watch list as well
think may need to free up some more $$$ to buy the dip
on the flip side dont want to have too many bags
rsi almost reset looking to add for a long term swing play as well

SWING IDEA - FINOLEX CABLESA potential swing trade in Finolex cables , a prominent figure in the cable manufacturing sector.
Reasons are listed below :
The stock bounced convincingly from the strong support level of 850, indicating solid buying interest at this price point.
A hammer candlestick on the weekly timeframe signals a potential reversal, suggesting a shift from bearish sentiment to bullish momentum.
The appearance of a morning star pattern on the daily chart adds further confirmation to the bullish bias, signaling a possible trend reversal from bearish to bullish.
The stock finds support at the 0.382 Fibonacci level, reinforcing the bullish outlook. Volume Surge: Witness a notable increase in trading volumes, reflecting growing market interest and potential accumulation by investors.
FinCables has been consistently making higher highs on larger timeframes, indicating a trend of increasing bullish momentum and reinforcing the potential for upward movement.
Target - 1020 // 1150 // 1210
Stoploss - weekly close below 805
DISCLAIMER -
Decisions to buy, sell, hold or trade in securities, commodities and other investments involve risk and are best made based on the advice of qualified financial professionals. Any trading in securities or other investments involves a risk of substantial losses. The practice of "Day Trading" involves particularly high risks and can cause you to lose substantial sums of money. Before undertaking any trading program, you should consult a qualified financial professional. Please consider carefully whether such trading is suitable for you in light of your financial condition and ability to bear financial risks. Under no circumstances shall we be liable for any loss or damage you or anyone else incurs as a result of any trading or investment activity that you or anyone else engages in based on any information or material you receive through TradingView or our services.
@visionary.growth.insights

Momentum in Finolex Cables (FINCABLES)Stock Analysis
This is the weekly chart of Finolex Cables (FINCABLES).
Momentum is coming into the stock, making a new high today and breaking the previous high from September 2023.
The stock is in an uptrend with high volume activities observed.
Trading Strategy
Swing and Positional Trading: Suitable for both swing and positional trading.
Target and Stop Loss: Levels are plotted on the chart.
Keep your stop loss below the mentioned level.
Hold for the minimum profit level, then trail your stop loss and ride with the price.
This setup is promising for a profitable trade. Stay disciplined and follow your plan!

Finolex cables looks like it will turn the tableFinolex Cables Ltd. principally engaged in the manufacturing of of Electricals Cables, Communication Cables & Other Electrical Appliances. Its manufacturing facilities are located at Panjim in Goa, Pune in Maharashtra and Roorkee in Uttarakhand.
Finolex Cables Ltd. CMP is 967.35. The Negative aspects of the company are High Valuation (P.E. = 23.1), Declining cash from operations annual, FIIs are decreasing stake, MFs are decreasing stake. The company's Positive aspects are No debt, Zero promoter pledge, Improving annual net profit.
Entry can be taken after closing above 983. Targets in the stock will be 1038, 1070 and 1107. The long-term target in the stock will be 1153, 1182 and 1221. Stop loss in the stock should be maintained at Closing below 834.
The above information is provided for educational purpose, analysis and paper trading only. Please don't treat this as a buy or sell recommendation for the stock. We do not guarantee any success in highly volatile market or otherwise. Stock market investment is subject to market risks which include global and regional risks. We will not be responsible for any Profit or loss that may occur due to any financial decision taken based on any data provided in this message.

Finolex CableFinolex looking good for swing if gives an upside breakout. Not a buy or sell recommendation just for educational views.

A Shift in Momentum: FINCABL's Trendline Analysis Introduction:In the world of technical analysis, trendlines play a crucial role in identifying potential patterns and predicting future price movements.
In this blog post, we'll dive into the analysis of FINCABL, a stock listed on the NSE stock exchange, and explore how a change in timeframe and trendline analysis can reveal a potential uptrend.
Current Market Price:
At the time of writing, FINCABL is trading at Rs.922, presenting an interesting opportunity for traders and investors alike. Before we begin our analysis, let's first examine the current market price in relation to the trendlines we'll be discussing.
Year-to-Date Chart (1-Day Timeframe):
When viewing the year-to-date chart with a 1-day timeframe, we can see that FINCABL has been in a downtrend, breaking below a support trendline (red line). This trendline was bearish, indicating that the stock was likely to continue its downward movement.
3-Month Chart (1-Hour Timeframe):
However, when we switch to a 3-month chart with a 1-hour timeframe, a different picture emerges. In this timeframe, FINCABL has formed a new support trendline (blue line) that has been respected for almost 10 days.
This trendline is bullish, suggesting a potential uptrend. Trendline Analysis: The red trendline (year-to-date) is acting as a resistance line, while the blue trendline (3-month) is a support line.
The stock has been trading above the blue trendline for the past 10 days, indicating a potential change in momentum.
Volume Analysis:
To further reinforce the bullish signal, we can look at the volume. An increase in volume often signifies a potential trend reversal. In the case of FINCABL, we can see that the volume has been increasing, which could be a sign of a potential uptrend.
MACD on OBV:
To confirm the bullish signal, we can apply the MACD (Moving Average Convergence Divergence) indicator on the OBV (On Balance Volume) indicator. The MACD on OBV is a bullish signal, indicating that the stock may be set to break above the red trendline (resistance) and continue its upward movement.
Conclusion:
In conclusion, by analyzing FINCABL's trendlines on different timeframes, we can identify a potential uptrend. The stock has broken above the blue trendline (support) and is trading above it, indicating a change in momentum. The increase in volume and bullish MACD on OBV signal further reinforce the potential uptrend. Traders and investors can consider taking a long position in FINCABL, with a stop-loss below the blue trendline and a target price above the red trendline (resistance).
However, it's important to remember that trendlines are not set in stone and can be broken. Therefore, it's essential to monitor the stock's movement and adjust positions accordingly.
Remember, technical analysis is just one tool to help you make informed investment decisions. Always combine it with fundamental analysis and risk management techniques to ensure a well-rounded approach to trading and investing.

FinolexCable Cup and handle formation breakout
NSE:FINCABLES
As seen on the chart, Finolex Cables have formed a nice U-shaped Cup and the handle is also not very deep.
Also, the volume was low when it was forming the handle and the breakout was with a significantly higher volume for the handle.
There is a high probability that this pattern will be successful.
Disc - invested, for educational purposes only.

Triangle Pattern Breakout - FINOLEX CABLESPlease look into the chart for a detailed understanding.
Consider these for short-term & swing trades with 2% profit.
For BTST trades consider booking
target for 1% - 2%
For long-term trades look out for resistance drawn above closing.
Please consider these ideas for educational purpose
Please note that, if there are some big targets, those are drawn thinking for long term.

FINOLEX CABLESIts forming a very good pattern on charts.
Above 1110 we can see a move of further 200 points.
Finolex cables charts showing good volume accumulation. it can be come out as a great investment.

Resistance BreakoutPlease look into the chart for a detailed understanding.
Consider these for short-term & swing trades with 2% profit.
For BTST trades consider booking
target for 1% - 2%
For long-term trades look out for resistance drawn above closing.
Please consider these ideas for educational purpose

Swing: Finolex Cables - Long breakout and RetraceFin cables made a good triangle breakout and Retraced with good volume. Also all the technical indicators shows buy signal.
Entry price : 894
Target : 995
Stoploss : 805

FINCABLES LONG an important level has been broken today in daily chart. uptrend can continue upto 1050 level.
I am not a sebi registered analyst. so, do your own research before investing.

Inside bar breakout with very good volumeInside bar breakout with very good volume + Cup & Handle Breakout
Bullish
MTM:775
Target:870
SL:700

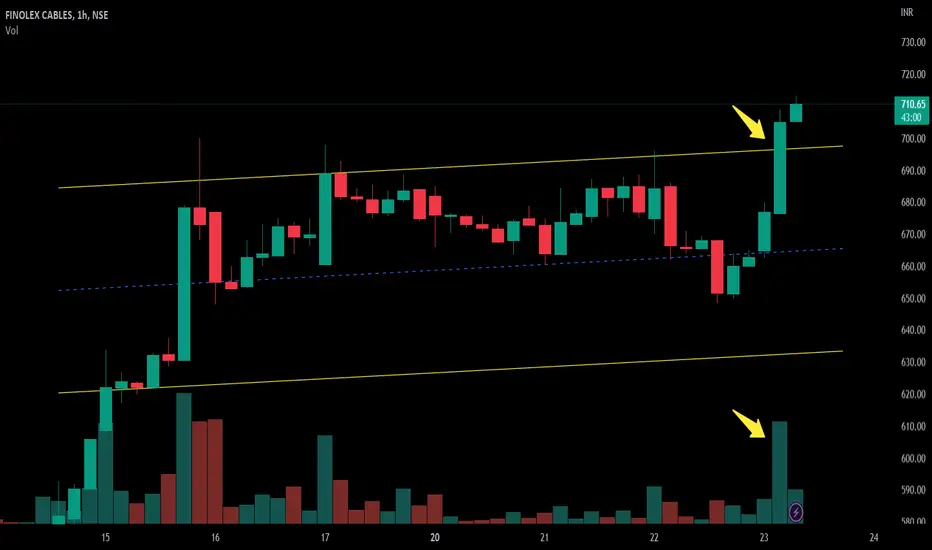
FINCABLES - possible multiyear breakoutCMP 720.25 | Strong Momentum | New 52 Week High | Company with No Debt
*Not recommendation
Finolex Cables Ltd is India`s largest and leading manufacturer of electrical and telecommunication cables

Resistance BreakoutPlease look into the chart for a detailed understanding.
Consider these for short-term & swing trades with 2% profit.
For BTST trades consider booking
target for 1% - 2%
For long-term trades look out for resistance drawn above closing.
Please consider these ideas for educational purpos

FincablesAfter a consolidation in a range din cable is good for a breakout buy above 722
Sl 688
Tgt 1:1
Ask your financial advisor before buying
Only for educational purposes

Trendline Breakout in Finolex Cables Limited...Chart is self explanatory.
Disclaimer: This is for demonstration and educational purpose only. This is not buying or selling recommendations. I am not SEBI registered. Please consult your financial advisor before taking any trade.