Positional Setup: Fine Organic Industries Ltd (FINEORG)📌 CMP: ₹5,177.90
📈 Technical Structure:
Stock has cleared a multi-month resistance around ₹5,090–5,100
Strong bullish momentum, with increasing volume
Clean rounded base breakout, suggesting trend reversal
📊 Indicators:
Trading above TEMA 5/9/20 – bullish signal
Supertrend also likely supporting a buy signal (though visually hidden)
RSI in bullish territory (not overbought)
📌 Key Levels:
Immediate Support: ₹5,090
Strong Base: ₹4,815
Resistance/Targets:
🎯 T1: ₹5,660
🎯 T2: ₹5,970
🎯 T3: ₹6,200+ (if momentum sustains)
🛡️ Stop Loss: ₹5,090 (daily closing basis)
FINEORG trade ideas

Ye Chart Kuch Kehta Hai - Fine OrganicFine Organic Industries' weekly higher highs over the past few weeks is driven by strong revenue growth, full capacity utilization, strategic expansion plans, favorable analyst outlook with rising target prices, and solid financial returns—all contributing to positive market sentiment and sustained buying pressure on the stock.
Strong Recent Price Performance and Market Sentiment : The stock has gained about 2.5% in the last week and approximately 28.7% over the past three months, reflecting strong investor confidence and positive momentum. It also recently hit a new 52-week high, indicating robust buying interest.
Positive Analyst Recommendations and Upward Target Price Revisions : Leading brokerage Prabhudas Lilladher has maintained a bullish stance on Fine Organic Industries, repeatedly upgrading its target price in recent months—from Rs 4,930 in mid-May 2025 to Rs 5,440 by early June 2025—based on strong growth prospects and improving fundamentals. This analyst optimism likely fuels buying interest.
Capacity Utilization and Expansion Plans : The company is operating its manufacturing plants at full capacity except for one facility in ramp-up phase, signaling strong demand for its products. Fine Organic is also investing in a Rs 7.5 billion greenfield capex project expected to start commercial production by FY27, which is projected to significantly boost future revenue potential (peak revenue potential of Rs 26 billion).
Growth in Revenue and Market Opportunities : Fine Organic reported consolidated revenue growth of 11% year-over-year and 18% quarter-over-quarter, driven by both domestic and export markets. The company is also expanding into developed markets like the US through new subsidiaries, which could further enhance margins and returns.
Robust Financial Metrics: Despite some recent pressure on profitability due to rising raw material (vegetable oil) prices, the company has maintained a strong return on capital employed (ROCE) of around 22% and return on invested capital (ROIC) of 34% over the past five years (excluding a supernormal FY23).
Market Capitalization and Sector Position : With a market capitalization of approximately Rs 14,747 crore, Fine Organic ranks 12th in the chemicals sector, reflecting its significant market presence and investor interest.

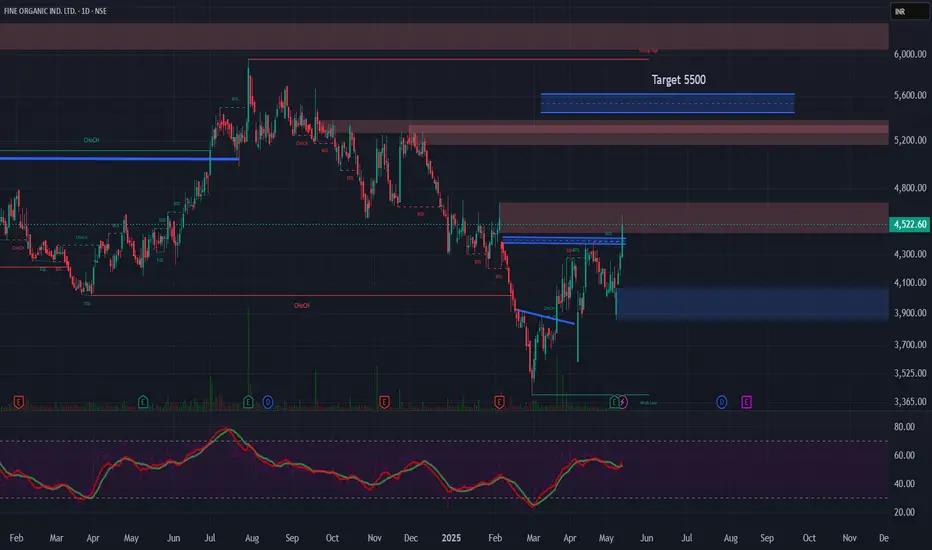
Cup and Handle Breakout - FINEORGFINEORG
Fine Organic Industries is engaged in and outside India as manufacturers, processors, suppliers, distributors, dealers, importers, exporters of wide range of oleochemical-based additives used in foods, plastics, cosmetics, coatings and other specialty application in various industries.
TARGET : ₹5500
TIME FRAME : 1 TO 3 month
Bullish Implications of the Cup and Handle Pattern:
Consolidation and Breakout: The Cup and Handle pattern typically forms after an uptrend, representing a period of consolidation (the "cup") followed by a smaller consolidation (the "handle"). The breakout occurs when the price moves decisively above the resistance level formed by the top of the handle, suggesting a continuation of the prior uptrend.
Increased Buying Pressure: A good breakout, especially on strong volume, indicates that buying pressure has overcome the previous resistance, and more buyers are likely to enter, driving the price higher.
Target Projection: A common method to estimate the target price after a Cup and Handle breakout is to measure the depth of the cup and add it to the breakout level.
Factors Supporting Your Analysis:
Well-Defined Pattern: The longer the pattern formation (February to May), the potentially more significant the breakout.
Good Breakout Today: A strong breakout day adds conviction to the bullish signal. Ideally, this breakout would be accompanied by higher than average trading volume.
Timeframe: Your 1 to 3-month timeframe is within the typical expectation for a Cup and Handle pattern to reach its target after a successful breakout.
Key Things to Monitor:
Breakout Confirmation: While today's breakout is positive, it's crucial to watch for confirmation in the coming days. The price should ideally hold above the breakout level and not quickly fall back below the handle's resistance.
Volume: Continue to monitor the trading volume. Sustained high volume on subsequent up days would further strengthen the bullish case.
Handle Integrity: The handle should ideally be a relatively shallow downward drift, typically in the upper half of the cup. A handle that is too deep might indicate more significant selling pressure and could weaken the pattern.
Market Conditions: Keep an eye on the overall market sentiment and any news or events that could impact the specialty chemicals sector or FINEORG specifically.
Stop-Loss Placement: It's essential to have a stop-loss order in place, typically below the handle's low or a recent swing low, to manage risk if the breakout turns out to be a false one.
Go long in Fine Organic Ind. Ltd.We are noticing a trenline breakout on daily frame. Above 5130, we can expect targets of 5350 & 5500.
SL would be near 4950

FINE ORGANIC INDIA LTD S/RSupport and Resistance Levels:
Support Levels: These are price points (green line/shade) where a downward trend may be halted due to a concentration of buying interest. Imagine them as a safety net where buyers step in, preventing further decline.
Resistance Levels: Conversely, resistance levels (red line/shade) are where upward trends might stall due to increased selling interest. They act like a ceiling where sellers come in to push prices down.
Breakouts:
Bullish Breakout: When the price moves above resistance, it often indicates strong buying interest and the potential for a continued uptrend. Traders may view this as a signal to buy or hold.
Bearish Breakout: When the price falls below support, it can signal strong selling interest and the potential for a continued downtrend. Traders might see this as a cue to sell or avoid buying.
20 EMA (Exponential Moving Average):
Above 20 EMA(50 EMA): If the stock price is above the 20 EMA, it suggests a potential uptrend or bullish momentum.
Below 20 EMA: If the stock price is below the 20 EMA, it indicates a potential downtrend or bearish momentum.
Trendline: A trendline is a straight line drawn on a chart to represent the general direction of a data point set.
Uptrend Line: Drawn by connecting the lows in an upward trend. Indicates that the price is moving higher over time. Acts as a support level, where prices tend to bounce upward.
Downtrend Line: Drawn by connecting the highs in a downward trend. Indicates that the price is moving lower over time. It acts as a resistance level, where prices tend to drop.
RSI: RSI readings greater than the 70 level are overbought territory, and RSI readings lower than the 30 level are considered oversold territory.
Combining RSI with Support and Resistance:
Support Level: This is a price level where a stock tends to find buying interest, preventing it from falling further. If RSI is showing an oversold condition (below 30) and the price is near or at a strong support level, it could be a good buy signal.
Resistance Level: This is a price level where a stock tends to find selling interest, preventing it from rising further. If RSI is showing an overbought condition (above 70) and the price is near or at a strong resistance level, it could be a signal to sell or short the asset.
Disclaimer:
I am not a SEBI registered. The information provided here is for learning purposes only and should not be interpreted as financial advice. Consider the broader market context and consult with a qualified financial advisor before making investment decisions.

Double Bottom BreakoutThe stock has broken the neckline of the double top bottom with 2.5x volumes on monthly basis. Buy between retracement of 5120-5170 for a target of 6250/6960

FINEORG: 3 Technical Possibilities 👌Okay, This one was requested by @Saikumarvsk
The Chart should tell you everything you need to know. But here are some specific pointers:
- The price looks to be in a consolidation mood
- We have a support trendline at play
- The Support and resistance zones are clearly marked
- The Psy. levels, 5000 and 4000 are positioned near the support and resistance. They will add to the strength of respective zones.
- The price is trading below the 200EMA on daily TF
- The MACD shows a slowdown but no bearish crossover yet
- It is too early to predict future price action at this point but below are some technical possibilities.
- Before we go there, Would you give us a boost for motivation? The more you like our posts, the more we will post.
1. ascending triangle scenario
2. Sideways consolidation.
If the price takes this route, The breakdown of the support trendline may not have much impact on the momentum.
3. Breakout of either zone (support or resistance zone).
A break and close above or below the zone may trigger a good momentum.
What is your take on Fine Organic?
Have Requests, Questions, or Suggestions? DM us or comment below.👇
⚠️Disclaimer: We are not registered advisors. The views expressed here are merely personal opinions. Irrespective of the language used, Nothing mentioned here should be considered as advice or recommendation. Please consult with your financial advisors before making any investment decisions. Like everybody else, we too can be wrong at times ✌🏻


FINE ORGANIC LOOKIGN BullishFINE ORGANIC is consolidating in box and range bound from long time at the same time the volume build up or accumulation is going on soon expecting Bullish/brake up.

Fine organic looks good for 5k++Long consolidation break
Vol need more to come
4800 resistance broken
5k target
Holding period 1week
Fine Organic Industries is engaged in and outside India as manufacturers, processors, suppliers, distributors, dealers, importers, exporters of wide range of oleochemical-based additives used in foods, plastics, cosmetics, coatings and other specialty application in various industries
Not a reco ..for educational purpose only

Another opportunity arises on FINE ORGANICIt's seems bull are back with that recovery last week, today's down move didn't cover all the up moves of previous candle this forming and continuing HH HL situation. So continue longing this stock is the idea. Good luck... Trade with proper risk management

Fine Organics - Buy timeWe can see the stock moving towards the previous highs
A crown pattern in making
Expecting 20 to 60% returns by next year
keep stop loss as 4180

Breakout soon and fundamentally strong stockStock Name :- Fine Organic
Company has delivered good profit growth of 45.4% CAGR over last 5 years.
Company has a good return on equity (ROE) track record: 3 Years ROE 36.0%
Debt To Equity Ratio - 0.02

STRONG BREAKOUT in FIN ORGANICS!!!! POTENTIAL of 38% PROFIT. After a long downside, FIN ORGANICS has given a strong BREAKOUT and a good trend reversal. You can expect 38% profits from this level (5100) within 4-6 months. For confirmation wait for this weekly close above 5100.
Comment if you have any queries.

Longterm stock looking good for reversal Fine organics is already a multibagger and leader in its segment. Decent fundamentals and available at discount. Safe people can keep sl below 4000 wcb

Fine Organic Cup with HandleFine Organic Cup with Handle Pattern Breakout 1 day chart 6300 Target Possible Coming <months….

Fine organic buy for 30% gainBullish available at good price
For 1 year
Long term investing
Driven by operators

FINEORG viewsAs per my understanding, this is one of the finest script, after listing and coincidently it has retraced a lot, in near past.
But now, the structure seems to be attractive as far as this script is concerned.
I feel it has built a support structure, and likely to make a new lifetime high.
Worth watching it for study purposes.

Buy zone in FINEORGPrice is near the demand zone and once the trendline is broken, price will likely to go up.
Just for educational purpose. But at your own risk.

Rounding pattern breakout with volumeRounding pattern breakout with volume
T1: 7590
SL: Breakout candle low

Shot term bearish, long term slightly bullish- Entry levelShort term sell and support levels. Perfect entry levels for profits

Fine Organics BreakoutThe stock has broken out and retested, therefore may undergo a reversal rally. Trade is supported by Supports Nearby.
Risk Reward Ratio - 2:1
SL is placed below the support zone & the lower trendline. The target is placed near resistance.

Fine Organics BreakoutThe stock has broken out and retested, therefore may undergo a reversal rally. Trade is supported by Supports Nearby.
Risk Reward Ratio - 2:1
SL is placed below the support zone & the lower trendline. The target is placed near resistance.
