Finpipe updated chart Finpipe updated chart in weeklt time frame can make bat pattern as marked.
will see if return from te mark "D"....
FINPIPE trade ideas
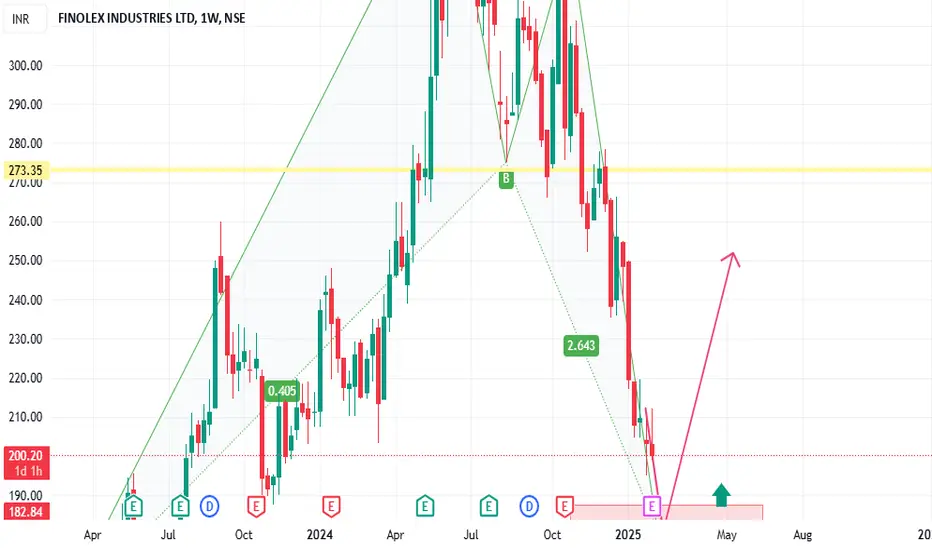
Finpipe looking good for upsideFinpipe looking good for upside once reach at "D" mark and it will complete upto 2nd target

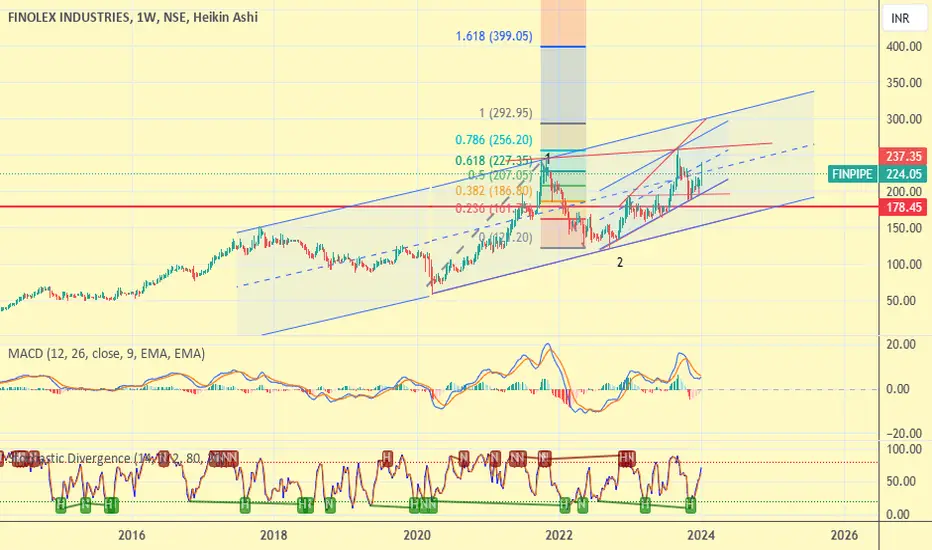
FINPIPE - Finolex Industries: A Perfect Wave SetupFinolex Industries Ltd: Wave Structure and Fibonacci Confluence Analysis
1. Overview
This chart analysis of Finolex Industries Ltd leverages Elliott Wave Theory and Fibonacci retracement zones to identify high-probability price movements. It captures the interaction of a primary wave (blue) and an intermediate wave (red), providing insight into the potential price reversal and future targets.
2. Technical Breakdown
Primary Wave (Blue): Reflects the major downtrend that defines the broader bearish structure of the market.
Intermediate Corrective Wave (Red): Represents the corrective structure of the ABC pattern, indicating a possible reversal zone.
Wave A: Initiates the corrective sequence with bearish pressure.
Wave B: Forms a minor retracement, lacking strong upward momentum.
Wave C: Extended downward move, aligning with the critical retracement zone of 113%–127% Fibonacci.
Critical Fibonacci Zone (113%–127%):
Acts as a key reversal zone. The completion of Wave C in this area often signals a potential bullish reversal.
Break of Structure (BoS):
The chart highlights a BoS, which suggests a shift in price action structure. If the price sustains above the ₹241–₹249 zone, it could lead to bullish momentum.
Target Zone (₹344–₹356):
Price is expected to head toward the retracement of the last high swing once the Wave C correction concludes.
Stop-Loss Placement:
Set below ₹235.55 on a day-close basis to manage risk. A failure to hold this level could lead to a deeper correction toward ₹214.39.
3. Logical Interpretation of Price Action
Elliott Wave Theory:
The corrective ABC wave structure is a classic setup for identifying potential reversals. Here, Wave C extends into the 113%–127% Fibonacci zone, a typical completion point for corrective patterns.
Break of Structure (BoS):
A BoS above ₹249 confirms structural strength. This is critical in signaling a shift in sentiment from bearish to bullish.
Volume Analysis:
The lack of significant volume during Wave B confirms limited buyer strength. A strong breakout above the BoS zone with volume would confirm bullish interest.
4. Strategy Recommendations
Entry Points:
Wait for bullish confirmation near the ₹241–₹249 zone (e.g., bullish candlestick pattern, volume surge).
Targets:
First Target: ₹344–₹356 (retracement of the last high swing).
Stop-Loss:
Below ₹235.55 on a day-close basis to manage downside risk.
Alternative Scenario:
If the price breaks below ₹241, expect a deeper correction toward the ₹214.39 support zone.
5. Educational Insights
Extended Fibonacci Levels (113%–127%):
These levels are critical in identifying the completion of corrective waves, particularly in Wave C structures. They often act as zones of reversal, offering high-probability trade setups.
Break of Structure (BoS):
A BoS above a key price level is a significant indicator of sentiment shift. Combined with volume and candlestick analysis, it helps traders build conviction.
Wave ABC Patterns:
Understanding corrective wave patterns allows traders to predict potential trend continuation or reversal points, aiding in better entry and exit timing.
6. Summary
This analysis of Finolex Industries Ltd combines Elliott Wave Theory and Fibonacci retracements to outline a potential bullish scenario. The setup offers a clear risk-reward strategy for traders, emphasizing key zones like the ₹241–₹249 support area and the ₹344–₹356 target zone. Adopting disciplined risk management with stop-loss placement ensures effective trade execution in a volatile market.

IS THE CORRECTION OVER FOR FINPIPE ?FINPIPE is currently trading around 264.7 while posting this idea.
It has formed a good bullish flag retracing to 61.8% of the Latest Swing on Weekly Time Frame
A tight stop at current candle low can be a great idea although the support zone extends upto 243
Immediate swing tgt can be at 295 while mkt consolidates further for the rest of the year
Disclaimer : I am not a SEBI registered advisor. This idea does not constitute any trading advise and is purely for educational purpose

FINOLEX INDUSTRIES LTD S/R Support and Resistance Levels:
Support Levels: These are price points (green line/shade) where a downward trend may be halted due to a concentration of buying interest. Imagine them as a safety net where buyers step in, preventing further decline.
Resistance Levels: Conversely, resistance levels (red line/shade) are where upward trends might stall due to increased selling interest. They act like a ceiling where sellers come in to push prices down.
Breakouts:
Bullish Breakout: When the price moves above resistance, it often indicates strong buying interest and the potential for a continued uptrend. Traders may view this as a signal to buy or hold.
Bearish Breakout: When the price falls below support, it can signal strong selling interest and the potential for a continued downtrend. Traders might see this as a cue to sell or avoid buying.
20 EMA (Exponential Moving Average):
Above 20 EMA(50 EMA): If the stock price is above the 20 EMA, it suggests a potential uptrend or bullish momentum.
Below 20 EMA: If the stock price is below the 20 EMA, it indicates a potential downtrend or bearish momentum.
Trendline: A trendline is a straight line drawn on a chart to represent the general direction of a data point set.
Uptrend Line: Drawn by connecting the lows in an upward trend. Indicates that the price is moving higher over time. Acts as a support level, where prices tend to bounce upward.
Downtrend Line: Drawn by connecting the highs in a downward trend. Indicates that the price is moving lower over time. It acts as a resistance level, where prices tend to drop.
RSI: RSI readings greater than the 70 level are overbought territory, and RSI readings lower than the 30 level are considered oversold territory.
Combining RSI with Support and Resistance:
Support Level: This is a price level where a stock tends to find buying interest, preventing it from falling further. If RSI is showing an oversold condition (below 30) and the price is near or at a strong support level, it could be a good buy signal.
Resistance Level: This is a price level where a stock tends to find selling interest, preventing it from rising further. If RSI is showing an overbought condition (above 70) and the price is near or at a strong resistance level, it could be a signal to sell or short the asset.
Disclaimer:
I am not a SEBI registered. The information provided here is for learning purposes only and should not be interpreted as financial advice. Consider the broader market context and consult with a qualified financial advisor before making investment decisions.

Volume Breakout - Swing TradeDisclaimer: I am not a Sebi registered adviser.
This Idea is publish purely for educational purpose only before investing in any stocks please take advise from your financial adviser.
Volume Breakout. Stock has give Breakout with Volume. Keep in watch list. Buy above the high. Suitable for Swing Trade. Stop loss & Target Shown on Chart. Exit With in 5 to 10 Days
Be Discipline because discipline is the Key to Success in the STOCK Market.
Trade What you see not what you Think

Finolex In oversold zonePositive results of jun24.stock looks oversold and institutional increased stake in previous quarter expecting a bounce back soon. keep strict SL.

FINOLEX INDUSTRIES LTD S/RSupport and Resistance Levels:
Support Levels: These are price points (green line/share) where a downward trend may be halted due to a concentration of buying interest. Imagine them as a safety net where buyers step in, preventing further decline.
Resistance Levels: Conversely, resistance levels (red line/shade) are where upward trends might stall due to increased selling interest. They act like a ceiling where sellers come in to push prices down.
Breakouts:
Bullish Breakout: When the price moves above resistance, it often indicates strong buying interest and the potential for a continued uptrend. Traders may view this as a signal to buy or hold.
Bearish Breakout: When the price falls below support, it can signal strong selling interest and the potential for a continued downtrend. Traders might see this as a cue to sell or avoid buying.
20 EMA (Exponential Moving Average):
Above 20 EMA: If the stock price is above the 20 EMA, it suggests a potential uptrend or bullish momentum.
Below 20 EMA: If the stock price is below the 20 EMA, it indicates a potential downtrend or bearish momentum.
Trendline: A trendline is a straight line drawn on a chart to represent the general direction of a data point set.
Uptrend Line: Drawn by connecting the lows in an upward trend. Indicates that the price is moving higher over time. Acts as a support level, where prices tend to bounce upward.
Downtrend Line: Drawn by connecting the highs in a downward trend. Indicates that the price is moving lower over time. It acts as a resistance level, where prices tend to drop.
RSI: RSI readings greater than the 70 level are overbought territory, and RSI readings lower than the 30 level are considered oversold territory.
Combining RSI with Support and Resistance:
Support Level: This is a price level where a stock tends to find buying interest, preventing it from falling further. If RSI is showing an oversold condition (below 30) and the price is near or at a strong support level, it could be a good buy signal.
Resistance Level: This is a price level where a stock tends to find selling interest, preventing it from rising further. If RSI is showing an overbought condition (above 70) and the price is near or at a strong resistance level, it could be a signal to sell or short the asset.
Disclaimer:
I am not a SEBI registered. The information provided here is for learning purposes only and should not be interpreted as financial advice. Consider the broader market context and consult with a qualified financial advisor before making investment decisions.

SWING IDEA - FINOLEX INDUSTRIESWith a rich legacy and a strong foothold in the industrial sector, Finolex Industries emerges as an intriguing candidate for swing traders seeking opportunities in the market.
Reasons are listed below :
Breakthrough Attempt: After multiple tests, the stock is attempting to break through the critical 240 level, signaling a potential bullish breakout.
Bullish Marubozu Candle: A bullish Marubozu candle on the weekly timeframe signifies strong buying pressure and potential upward momentum.
Candlestick Engulfing Pattern: This week's candle has engulfed the previous eight weekly candles, indicating a significant shift in market sentiment towards bullishness.
50 EMA Support: The 50-period Exponential Moving Average (EMA) on the weekly chart acts as reliable support, reinforcing the bullish bias.
0.618 Fibonacci Support: Finding support at the 0.618 Fibonacci level strengthens the bullish case, suggesting a solid foundation for potential upward movement.
Constant Higher Highs: The stock has consistently formed higher highs, reflecting a trend of increasing bullish momentum and reinforcing the potential for further gains.
Target - 300 // 325
Stoploss - weekly close below 203
Disclaimer :
Decisions to buy, sell, hold or trade in securities, commodities and other investments involve risk and are best made based on the advice of qualified financial professionals. Any trading in securities or other investments involves a risk of substantial losses. The practice of "Day Trading" involves particularly high risks and can cause you to lose substantial sums of money. Before undertaking any trading program, you should consult a qualified financial professional. Please consider carefully whether such trading is suitable for you in light of your financial condition and ability to bear financial risks. Under no circumstances shall we be liable for any loss or damage you or anyone else incurs as a result of any trading or investment activity that you or anyone else engages in based on any information or material you receive through TradingView or our services.
@visionary.growth.insights

FINOLEX INDUSTRIESChart is self explanatory. Breakout awaited in Finolex. Cheers.
Not a recommendation. Just an observation.

#FINPIPE 231#invest target330 #nifty #banknifty #trading #btcusdFINPIPE 231
Target 330+
RR > 4
Return >40%
Risk <9%
Timeframe < 8M
NSE:FINPIPE
Buy Recommended
Can hold for long term
Shared with 💚
By Rachit Sethia


Finolex industries Breakout retest and breakout
Above 280 it will rock
With small stoploss we can enter the trade here
#finpipe

FINPIPE long for swing tradeThis chart for swing position if chart time frame daily then period 01 to 03 month. or 1H to 4H then 01 to 10 days .
All instructions are given upper on chart . as a all level order, entry, exit.
Its not a call tips advisory only for education purpose. Your position your self care.

Flag Pattern Inside Cup handle breakoutWE observed the one flag pattern breakout, inside the flag made cup handle pattern breakout.
two types of pattern we seen in same chart and both are breakout out

Multiple Indicators - FINPIPE📊 Script: FINPIPE
📊 Sector: Plastic products
📊 Industry: Plastic products
Key highlights: 💡⚡
📈 Script is trading at upper band of BB and giving breakout of it.
📈 MACD is giving crossover .
📈 Double Moving Averages are on urge of crossover.
📈 Right now RSI is around 60.
📈 One can go for Swing Trade.
⏱️ C.M.P 📑💰- 235
🟢 Target 🎯🏆 - 260
⚠️ Stoploss ☠️🚫 - 222
⚠️ Important: Always maintain your Risk & Reward Ratio.
✅Like and follow to never miss a new idea!✅
Disclaimer: I am not SEBI Registered Advisor. My posts are purely for training and educational purposes.
Eat🍜 Sleep😴 TradingView📈 Repeat 🔁
Happy learning with trading. Cheers!🥂

FINOLEX IND/PIPE -contracting trianglebreakout or breakdown of contracting triangle near to our trg of 255,58 and 262 . If crosses 262 with volume then we have a target of 310 rs but some profit booking in this range expected.

FINPIPEStock name - Finolex Industries Limited.
Daily chart setup
Heavy Volumes
7% to 12% Quick Move Possible
Master Score - B
Disclaimer: This is for demonstration and educational purpose only. this is not buying and selling recommendations. I am not SEBI registered. please consult your financial advisor before taking any trade.


FINPIPE Breakout on various indicatorsFinpipe had recently cleared its Oct 2021 range and with close on 22 Mar 2024, has registered a strong weekly candle breaking out of a symmetrical triangle at breakout levels.
The stock can potentially give 25-40% returns in the coming few months.
The stock has a PE of 32.33 which is below the segment PE of 46
chart looks poised for a sustained breakout


FINOLEX Industries : 10 MILLION VOLUMETechnical:
Price consolidation is over.
LOng bullish candle
Volume approx 10 million in 1 day
RSI and MACD are giving bullish signals.
TARGET -1 : 250
TARGET -2 : 280
STOP LOSS: 220
**These are my personal observations. Please trade at your own risk.**

finolex ind buyfinolex ind/pipe intial trg 257-60 once this is crossed we are heading toward 300 odd level . fibo ext trg gives us a target of 399-400 level. if corrects near to 208 level( trendline support) accumulate in large qty ( as nifty 3.2 to started or to start soon)