GAIL trade ideas


GAIL - Potential Stock with Stable GrowthI personally love the stock & it's growth side improvements.
The thing is similar to WIPRO in case of growth between strong parallel range.
GAIL BUY on fundamentals are also working perfectly with low debt & good dividend company.


Ascending Trend line Target will be 107
In 1 hr time frame HH formed ,
so it indicates candle will move
in Bullish side. we can go for buy


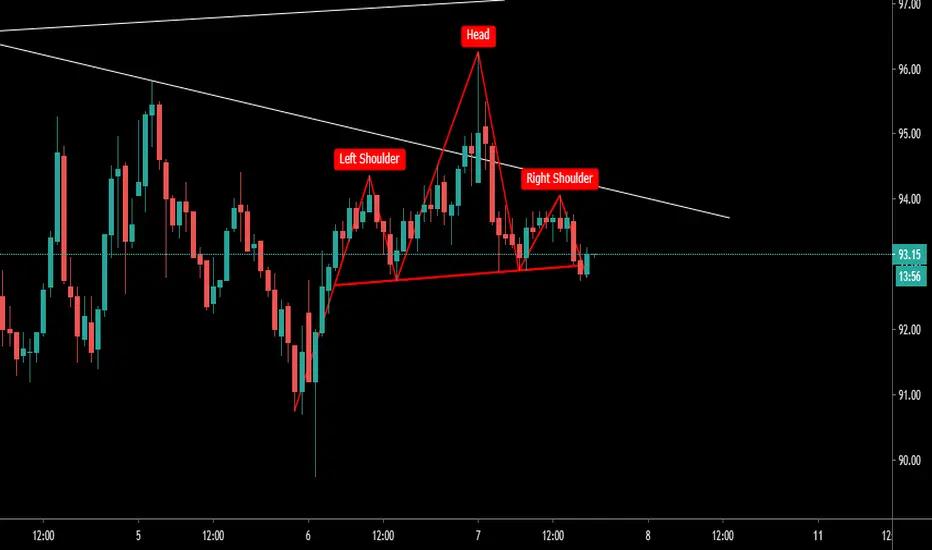
Short Gail - Dark cloud pattern formedNSE:GAIL
There's a very prominent dark cloud pattern formed at the peak of the previous rally. The dark cloud pattern combined with the relatively high volume is a moderately reliable indicator of a trend reversal. Also note that , GAIL has been forming a bearish flag pattern. This, coupled with the fact that it has been consistently trading under the 200 day moving average signals a strong probability of a trend reversal

RSI Analysis of Gail IndiaFrom the hourly chart of Gail India, we can see on the RSI indicator that it is showing negative divergence. I have drawn trend lines on the price chart so take your buying/shorting decision accordingly.
Buy above above trend line confirmation (Let RSI trend peak line be broken)
Short below below trend line confirmation

Gail positinal gail break out entry at 98
Target of 100 --( 3- 8 ) days
102 - 14 days
106 -- 30 days holding


Trap LineHey Guys, Please support - Hit Like.
Yes I did not spelled it wrong (Trap Line), While i was following Gail's chart, I found it has trap the investors at this same level, Please don't get into the trade unless until it decisively breaks the trend line with high volume, Also notice RSI getting stronger showing Bullish Trend Should to be continue. If it has to go up than should show some consolidation on resistance level shown into the chart, if it allows us to enter than our first target should be around 111. I will update you further if i catch something. Do not get Trapped Please support.
Thanks.


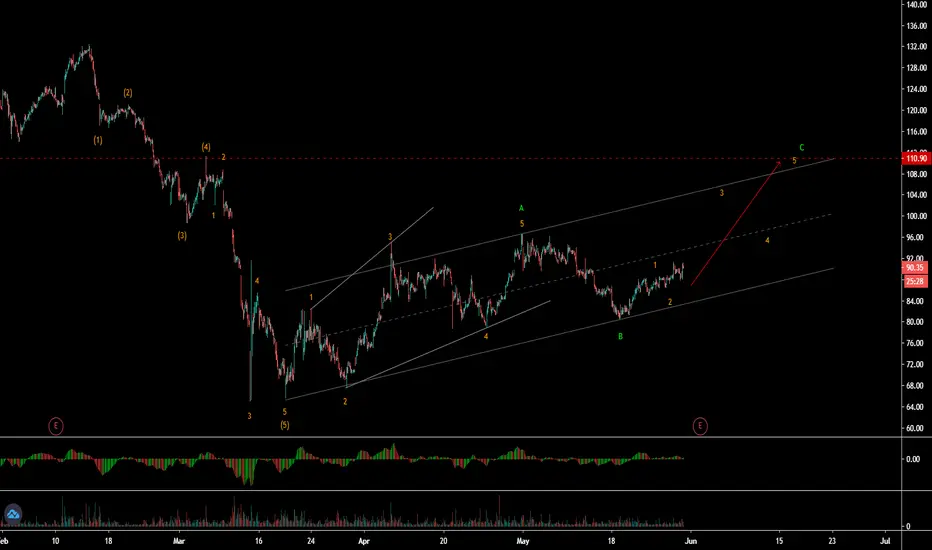
Gail Ltd (Gail - NSE) - ABC zigzag wave patternGail Ltd (Gail - NSE) is in ABC zigzag wave pattern in 60 min time frame from last bottom. Wave A was in leading diagonal, which means wave C will be going much higher. Wave B has completed in sharp and wave C is already moved up, which is in 2nd wave and will over any time soon. In weekly time frame it complete downside WXY wave. Now its started new up cycle.

finding opportunitygail may go in sideways,planning to buy as it has come for the first time at the previously broken resistnace which has become now support.avtually i m in buy since yesteday..for positional..let see

GAIL (at S : 80)Following trend line, breakout of lower trend line should be price likely going to 40.

Gail Buy setup For intraday !Hello if you are an intraday trader you can buy between 85-83 with stop loss 78 easy target 90-95-100-105
Thanks, Join the group for the update !

guys let us know your views please stock has recently break its downtrend so possibility is tht i should go up at least by 5 %.please let me know in the comments wht u think from u r analysis