GARWARE TECH FIBERS LTD S/RSupport and Resistance Levels:
Support Levels: These are price points (green line/shade) where a downward trend may be halted due to a concentration of buying interest. Imagine them as a safety net where buyers step in, preventing further decline.
Resistance Levels: Conversely, resistance levels (red line/shade) are where upward trends might stall due to increased selling interest. They act like a ceiling where sellers come in to push prices down.
Breakouts:
Bullish Breakout: When the price moves above resistance, it often indicates strong buying interest and the potential for a continued uptrend. Traders may view this as a signal to buy or hold.
Bearish Breakout: When the price falls below support, it can signal strong selling interest and the potential for a continued downtrend. Traders might see this as a cue to sell or avoid buying.
MA Ribbon (EMA 20, EMA 50, EMA 100, EMA 200) :
Above EMA: If the stock price is above the EMA, it suggests a potential uptrend or bullish momentum.
Below EMA: If the stock price is below the EMA, it indicates a potential downtrend or bearish momentum.
Trendline: A trendline is a straight line drawn on a chart to represent the general direction of a data point set.
Uptrend Line: Drawn by connecting the lows in an upward trend. Indicates that the price is moving higher over time. Acts as a support level, where prices tend to bounce upward.
Downtrend Line: Drawn by connecting the highs in a downward trend. Indicates that the price is moving lower over time. It acts as a resistance level, where prices tend to drop.
Disclaimer:
I am not SEBI registered. The information provided here is for learning purposes only and should not be interpreted as financial advice. Consider the broader market context and consult with a qualified financial advisor before making investment decisions.
GARFIBRES trade ideas

GARWARE New Short Trade OpportunityGARWARE TECH (15-Minute Timeframe) - Short Trade Opportunity
Trade Setup:
A clear short trade setup has emerged on the 15-minute timeframe for Garware Tech using the Risological swing trading indicator . The entry signal indicates a strong bearish move, supported by the break below key support levels.
Key Levels:
Entry: 4419.05
Stop Loss (SL): 4602.05
Take Profit Targets:
TP1: 4192.90
TP2: 3827.00
TP3: 3461.05
TP4: 3234.90
Technical Indicators:
The bearish crossover and the downward trajectory of the moving averages highlight the weakening momentum. The Risological Swing Trader Indicator confirms a high-confidence short entry with well-defined targets.
Strategy Note:
Traders are advised to monitor price action near TP1 and TP2 for potential retracements. Adjust stop-loss levels dynamically as the trade progresses to protect profits.
This short trade setup offers a promising risk-reward ratio for intraday traders! Stay disciplined and let the technicals lead the way.

GARFIBRES1. Anything can happen.
2. You don't need to know what is going to happen next in order to make money.
3. There is a random distribution between wins and losses for any given set of variables that define an edge. No other thoughts
4. An edge is nothing more than an indication of a higher probability of one thing happening over another.
5. Every moment in the market is unique.

Garware Tech: Poised to progress?Counter going strong even in weak market, can take two or more sessions to form a handle or can directly give BO with a strong candle. Need closure above 4350, can run swiftly till 4950 afterwards. Note that Market support is required for BO.

Garware Tech Fibres BreakoutNSE:GARFIBRES has given a breakout on weekly time frame and the company looks in a good spot to buy with a stop loss at 4000. It has been correcting for a very long time and finally we can see some momentum coming back here.

GARFIBRE - BREAKOUTNSE:GARFIBRES Weekly price volume breakout from consolidation with macd. Create huge breakout may continue price momentum to medium and long term.


GARWARE TECHBreakout from previous year high
If Price sustain this level more upmove could be possible

Garware TechnicalBreakout spotted with monthly close above all previous closings.
Disclaimer: Intended for educational purpose only and it's not a buy or sell recommendation.

Garware technical 2yr old trendline breakout Garware technical 2yr old trendline breakout With good volumes today closing with good fundamentals for swing target of 4027 and 4879.

Garware fiber... Good base formed in last few weeks... CMP 3400 Target 3700, 4100,
Tf 6-10 months
Keep SL dcbsl 3280

Garware Technical DailyName : Garware Technical
Sector : Technical Textile
Cmp : 3224
Breakout Level : 3280 ( Daily Closing Basis)
Stop Loss : 3000
Target : 4030+
Holding period : 3 to 9 Months

garfibresadd GARFIBRES at cmp and near 3600
we seen 3939/4040/4123/4223+
Note : all views are education purpose only.

Garware Technicaltrendline breakout observed plus retesting
SL below marked green zone.
Just for education


Garware Technical Fibres- Cup & HandleRisk- Reward is favourable here. Also, cup & handle shows trend resumption.

GARWARE FIBRES @ATH but still hotPls buy close to 2200 (half the sterday range) and ride the ATH ride..
Let's have faith in charts to hold a running stock


Garware Techincal: Long @ 1740-1750, tgt-2200Garware Techincal: Long @ 1740-1750, tgt-2200. Vol looks really good at 1750 so it'll def take support here. SL closing below TL.

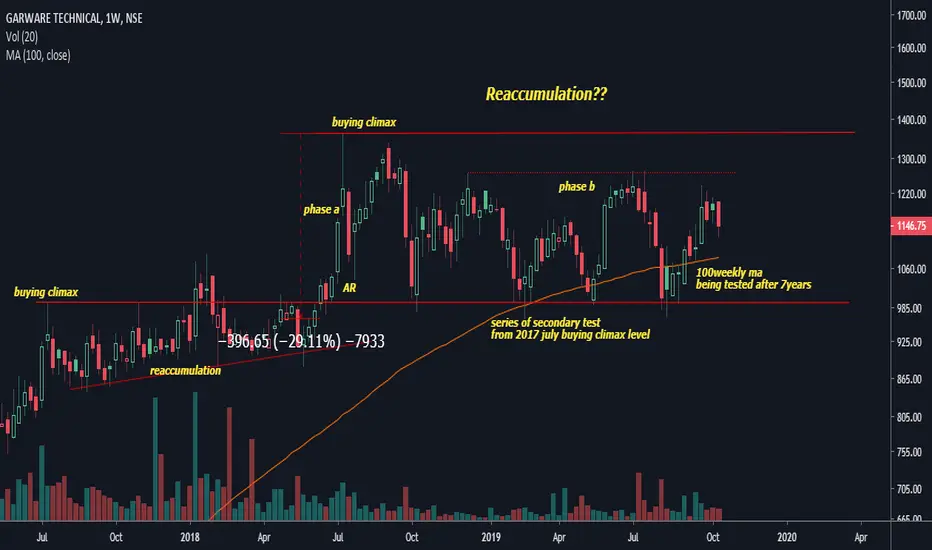
excellent numbers and balance sheet, reaccumulation ?disclaimer... not an investing/trading recommendation