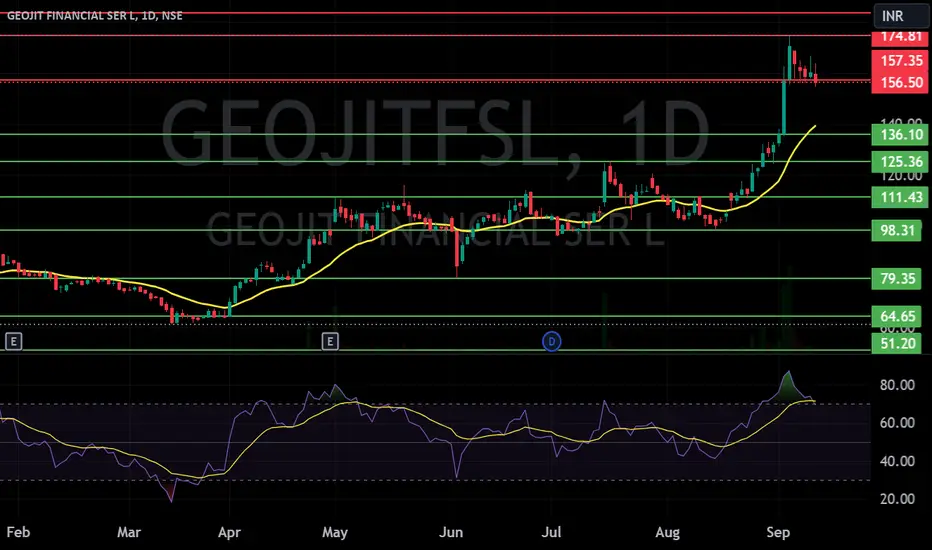
Geojit Financial : Bounce back ??Geojit financial is bouncing back.
volume dried up showing institutional accumulation zone
buy above 90 ( 200 EMA breakout )
Target 110 ( 0.5 fib retracement)
20% upside
This is purely for educational purpose and not a buy sell recomendation
GEOJITFSL trade ideas

Geojit coming down to demand levelGeojit has given a fantastic run up and broke the previous major resistance....It is now coming down to its demand level....You can start accumulating at 50-60 levels and aim for the last high, but price action has to show buyers are interested....I will be buying at those levels and will average down....Multiple sell orders till 150 and higher.....

GEOJITFSLNSE:GEOJITFSL
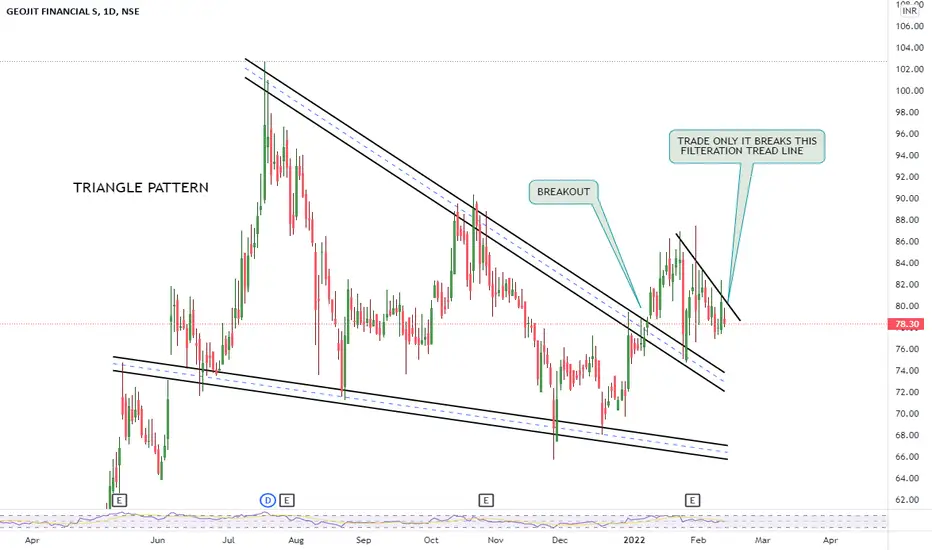
One Can Enter Now !
Or Wait for Retest of the Trendline (BO) !
Or wait For better R:R ratio !
Note :
1.One Can Go long with a Strict SL below the Trendline or Swing Low.
2. R:R ratio should be 1 :2 minimum
3. Plan as per your RISK appetite and Money Management.
Disclaimer : You are responsible for your Profits and loss, Shared for Educational purpose

Stock Broking co stocks good to accumulateSince SEBI has now requested to revise the lot size for F&O from end-Nov'24. Many mid-sized traders will lose the opportunity of trading on F&O. This may result in physical stock based purchase and sales increase for these mid-size people. Hence demat delivery charges revenue expected to increase for these stock broking cos. Its best to accumulate these stocks for gains.
Trading in F&O, especially for stock f&o will be extremely risky, as there will be less liquidity. For example, even a trader having capacity to buy 20 lots now, will be limited to 8 lots after implementation. This will result in riskier biz even for big size traders. It will be limited to institutions now. Good move by govt. This will encourage max physical delivery based trading.
Immediate effect, indices expect to move up as there will not be multiple transactions on physical trading, due to brokerage and taxes. So people will buy and hold and expected to plan for long term instead of short term. If the super trend gradually reverses , they may offload and enter if trend continues. Short selling without physical stock will be limited.
Once implemented, shorts sellers (F&O) will be caught (one knows only the selling price), unless base trend is on reversal or downward. Opposite in downward trend, short buyers will be caught (one knows only the buying price). Its always better to have physical stock for selling F&O and Cash for F&O buying, just in case either of the thing happens. IMHO, its the only safe way to do F&O.
Physical stock holders will be caught when market down (as the big sellers also will sell and by forming lower circuit with no liquidity in downtrend). Small-medium size investors cannot hedge their physical stocks. Hedging can be possible, only if one have their portfolio size of min 20lakhs. Only super rich can hedge :-). The entire stock market may be very riskier for trade, especially for mid-size traders. Cautious approach is required. Its always better to trade with just 40% max of one's capital, even for physical stock trading. This will protect during bad news time, where index itself hitting lower circuits (like during corona).
Above just for educational purpose.

Geojit Financial Services Positional TradeGeojit Financial Services, the stock has made a significant upward movement but is now consolidating between ₹145 and ₹160. With the current price near ₹155 and strong support at ₹145, this suggests a potential range-bound trading opportunity.
Positional Trade Idea:
Entry: Buy near ₹145-150 on dips with a stop loss below ₹140.
Target: Initial target ₹160, followed by ₹175 on breakout.
Risk: Keep a close watch on the ₹145 support level, as a breach could lead to downside risks.
Key indicators like volume and RSI could provide further confirmation of trend direction.

GEOJITFSL @ breakout of 16 years after year 2008 GEOJITFSL given multiyear breakout after year 2008, all finance related stocks like JM financial and M&M Finance also giving excellent breakout.

GEOJITFS S/RSupport and Resistance Levels:
Support Levels: These are price points (green line/shade) where a downward trend may be halted due to a concentration of buying interest. Imagine them as a safety net where buyers step in, preventing further decline.
Resistance Levels: Conversely, resistance levels (red line/shade) are where upward trends might stall due to increased selling interest. They act like a ceiling where sellers come in to push prices down.
Breakouts:
Bullish Breakout: When the price moves above resistance, it often indicates strong buying interest and the potential for a continued uptrend. Traders may view this as a signal to buy or hold.
Bearish Breakout: When the price falls below support, it can signal strong selling interest and the potential for a continued downtrend. Traders might see this as a cue to sell or avoid buying.
20 EMA (Exponential Moving Average):
Above 20 EMA: If the stock price is above the 20 EMA, it suggests a potential uptrend or bullish momentum.
Below 20 EMA: If the stock price is below the 20 EMA, it indicates a potential downtrend or bearish momentum.
Trendline: A trendline is a straight line drawn on a chart to represent the general direction of a data point set.
Uptrend Line: Drawn by connecting the lows in an upward trend. Indicates that the price is moving higher over time. Acts as a support level, where prices tend to bounce upward.
Downtrend Line: Drawn by connecting the highs in a downward trend. Indicates that the price is moving lower over time. It acts as a resistance level, where prices tend to drop.
RSI: RSI readings greater than the 70 level are overbought territory, and RSI readings lower than the 30 level are considered oversold territory.
Combining RSI with Support and Resistance:
Support Level: This is a price level where a stock tends to find buying interest, preventing it from falling further. If RSI is showing an oversold condition (below 30) and the price is near or at a strong support level, it could be a good buy signal.
Resistance Level: This is a price level where a stock tends to find selling interest, preventing it from rising further. If RSI is showing an overbought condition (above 70) and the price is near or at a strong resistance level, it could be a signal to sell or short the asset.
Disclaimer:
I am not a SEBI registered. The information provided here is for learning purposes only and should not be interpreted as financial advice. Consider the broader market context and consult with a qualified financial advisor before making investment decisions.
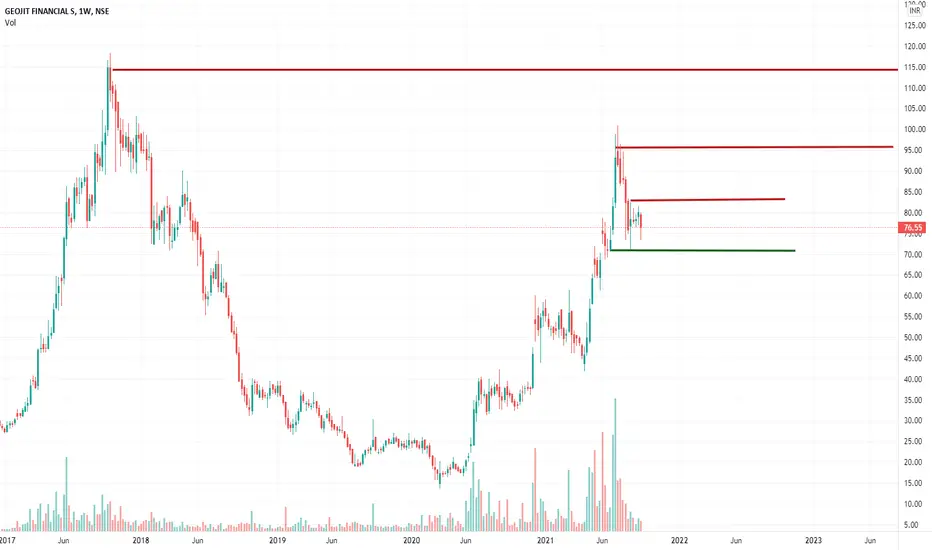
GEOGIT FINANCIAL : TRADE LEVELSConsidering retest of Swing B/O is done on Red Horizontal line (125), Geogit is one of the best stocks to play as a swing trade

geojit financial servicesgeojit financial services formed cup & handle with support 95 we can see 170 and 200 short term
cup and handle pattern sucess rate 95%
utilize dips

Long Term Trade For 80% ProfitGeojit Financial Services Limited offers a complete spectrum of financial services including online broking, financial products distribution, portfolio management services, margin funding, etc.
* key Points
# Increasing Profit & Sales
# P.E - 16
# R.O.C.E - 18.8%
# Promoter Holding - 54.59%
# FII & DII Holding Increasing

GEOJITFSL report good numbers1. Anything can happen.
2. You don't need to know what is going to happen next in order to make money.
3. There is a random distribution between wins and losses for any given set of variables that define an edge. No other thoughts
4. An edge is nothing more than an indication of a higher probability of one thing happening over another.
5. Every moment in the market is unique.

GEOJITFSL | SWING | LONGPrice is currently in stage 1, ready to enter stage 2.
Price is contracting nicely on Daily TF, near previous swing highs.
Volume dry-up on daily TF.
There is some overhead supply that must be considered before making any entries.

GEOJITFS Long PositionalBuy GEOJITFS above 99
for the Target of 106-145-210
SL 66
Strategy : BO + RSI > 60 + EMA above 20 & 50
Duration few Weeks
Remember there may be some retracement so accumulate more

MULTIYEAR BREAKOUT Multiyear breakout above 106 if closes above 106 on a weekly chart long term target will 135.140.150 with a stop loss of 85

GEOJITFSL CMP 93Geojit Financial Services Limited offers a complete spectrum of financial services including online broking, financial products distribution, portfolio management services, margin funding, etc.
Market Cap - ₹ 2,225 Cr.
Stock P/E - 18.1
Inverted Head & Shoulders Pattern formed

GEOJITFSL - Geojit Financial S - An Opportunity to BuyAs per previous chart history and present chart pattern, an opportunity is seen to buy this stock above 89 or wait for a strong pullback from the no trading zone as mentioned on the chart
Buy Above 88
Sell at 110
Do your own research before buying this stock as I am not SEBI registered person
Thanks for your support as always

💥Geojit Financial Services💥-Nice Breakout💥Geojit Financial Services💥-Nice Breakout
Capital to be deployed- 20k
Investing Price-72-75
Breakout Price-72
Stoploss-59
Targets-95-107-177
RT for max reach
#geojit #stockstowatch #StocksToBuy #StocksInFocus #stocks #StockMarket

GEOJITFSL towards 100- Good fundamentals
- Net profit rising
- 52W breakout with volume
- EMA crossover
Buy between 65 and 67 targeting 100rs..


GEOJITFSLNSE:GEOJITFSL
Please note that we are not a SEBI Registered Investor Adviser/PMS/ Broking House.
All the contents over here are for educational purposes only and are not investment advice or recommendations
offered to any person(s) with respect to the purchase or sale of the stocks / futures and options.
You are also requested to apply your prudence and consult your advisers in case you choose to act on
any such content available as WE claims no responsibilities for any of your actions or any outcome of
such action
GEOJIT FINANCIALSDemat account opening is at life time high , this is the broker in south india. cmp: 78.05

GeojitGeojit Etihasik teji wala share
.........................................................
..........................
Geojit finance rounding bottom weekly trendIn the chart we see that Geojit finance has formed a clear rounding bottom and the trend channel is followed by the script.
Here clear targets are 140 and 200 in coming time with stop loss near 65-67 range. Almost risk reward of 1:7
Plan your trade wisely.
Happy trading :)
Regards,
Kunal
