GICRE CMP 460.Last month i was made its new all time high with multi year breakout.460 level is its retest level and it respecting this level.Now on weekly time frame we can see a reversal candle.After budget full chance that this sector Perform in coming days.Add this to your wachlist.And see how it perform.
GICRE trade ideas

GIC Monthly Chart, Accumulate on all Dips.
Long Term Investment
Stop Loss - 312
TGT - 2400
I am not SEBI Registered.

GICRE - Multi year breakoutDouble Digit ROCE and ROE
PEG Ratio < 1
Debt to Equity = 0
PE in buy zone
FII and DII stake increased.
Ideal buy from a long term perspective.

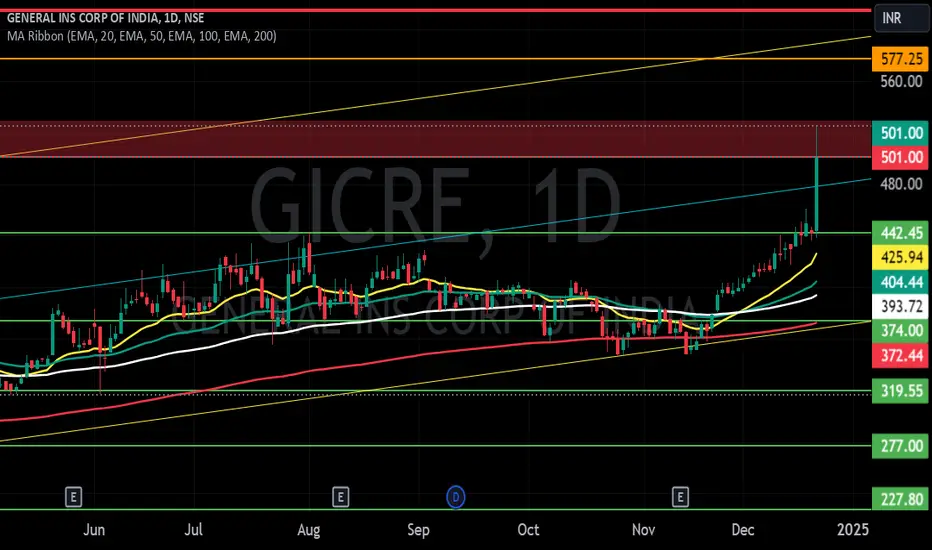
GENERAL INS CORP OF INDIA S/R Support and Resistance Levels:
Support Levels: These are price points (green line/shade) where a downward trend may be halted due to a concentration of buying interest. Imagine them as a safety net where buyers step in, preventing further decline.
Resistance Levels: Conversely, resistance levels (red line/shade) are where upward trends might stall due to increased selling interest. They act like a ceiling where sellers come in to push prices down.
Breakouts:
Bullish Breakout: When the price moves above resistance, it often indicates strong buying interest and the potential for a continued uptrend. Traders may view this as a signal to buy or hold.
Bearish Breakout: When the price falls below support, it can signal strong selling interest and the potential for a continued downtrend. Traders might see this as a cue to sell or avoid buying.
MA Ribbon (EMA 20, EMA 50, EMA 100, EMA 200) :
Above EMA: If the stock price is above the EMA, it suggests a potential uptrend or bullish momentum.
Below EMA: If the stock price is below the EMA, it indicates a potential downtrend or bearish momentum.
Trendline: A trendline is a straight line drawn on a chart to represent the general direction of a data point set.
Uptrend Line: Drawn by connecting the lows in an upward trend. Indicates that the price is moving higher over time. Acts as a support level, where prices tend to bounce upward.
Downtrend Line: Drawn by connecting the highs in a downward trend. Indicates that the price is moving lower over time. It acts as a resistance level, where prices tend to drop.
Disclaimer:
I am not a SEBI registered. The information provided here is for learning purposes only and should not be interpreted as financial advice. Consider the broader market context and consult with a qualified financial advisor before making investment decisions.
General Insurance Corporation - Clean Breakout on Monthly ChartLooks perfect to go long, one can buy in a staggered manner keeping in view of next one year

GICRE Weekly symmetrical triangle breakoutGICRE Weekly Symmetrical Triangle Breakout 🚀
Analysis:
GICRE has broken out of a symmetrical triangle pattern on the weekly chart, accompanied by a significant volume spike.
Breakout Level: ₹450
Current Price: ₹501 (+13.23%)
Volume: 53.43M (above the 8.01M average)
Key Levels:
Upside Targets: ₹550 | ₹600
Support Zone: ₹450
Trade Setup:
Look for sustained buying or a retest near ₹450 for potential entry.
📌 High probability trade with bullish confirmation. Maintain proper risk management!


GIC Re: Eyeing a Potential Breakout on the Weekly ChartThe stock of General Insurance Corporation of India (GIC Re) is exhibiting a promising technical setup as it consolidates near critical resistance. With strong price action and an ascending triangle pattern forming, the stage seems set for an upward breakout.
Key Levels and Setup
📈 Support Trendline: The stock has consistently respected an upward trendline, starting from lower levels and providing a strong base for price action.
📌 Immediate Resistance: ₹440–₹460 is the critical zone to watch. A breakout above this level could open doors to significant upside potential.
🚀 Upside Targets:
Target 1: ₹520
Target 2: ₹740
📉 Stop-Loss: To manage risk, a stop-loss can be placed below ₹430, near the ascending trendline support.
Trading Plan
Breakout Confirmation: Look for a weekly close above ₹460 with a noticeable increase in volume to confirm the breakout.
Retest Entry: If the stock retests ₹440–₹460 as support, it could provide a low-risk entry opportunity for positional traders.
Volume and Momentum
Keep an eye on trading volume as the stock approaches ₹460. A high-volume breakout will reinforce the bullish case, increasing the likelihood of sustained upward momentum.
⚠️ Warning: Markets are unpredictable, and no setup guarantees profits. Always use proper risk management strategies to protect your capital.
Disclaimer: This is not financial advice. Always perform your own analysis or consult with a financial advisor before making any investment decisions.
💬 What are your thoughts on GIC Re’s potential breakout? Do you think it will hit ₹740? Let me know in the comments below!
🚀📊 Don’t forget to follow, like, comment, and share for more insights like this!
#GICRe #TechnicalAnalysis #StockBreakout #TradingSetup

Can General Insurance Corporation will touch 550?? As per Harmonic PRZ pattern, GICRE may upto T1, T2, T3 i.e. 477, 550, 656 respectively.

#General Insurance Corporation of India#GICRE breakout Symmetrical Triangle Pattern
Entry :- Buy Above 430
Stop Loss :- 385
Target :- 468 and 505

GENERAL INS CORP OF INDIA S/RSupport and Resistance Levels:
Support Levels: These are price points (green line/shade) where a downward trend may be halted due to a concentration of buying interest. Imagine them as a safety net where buyers step in, preventing further decline.
Resistance Levels: Conversely, resistance levels (red line/shade) are where upward trends might stall due to increased selling interest. They act like a ceiling where sellers come in to push prices down.
Breakouts:
Bullish Breakout: When the price moves above resistance, it often indicates strong buying interest and the potential for a continued uptrend. Traders may view this as a signal to buy or hold.
Bearish Breakout: When the price falls below support, it can signal strong selling interest and the potential for a continued downtrend. Traders might see this as a cue to sell or avoid buying.
20 EMA (Exponential Moving Average):
Above 20 EMA(50 EMA): If the stock price is above the 20 EMA, it suggests a potential uptrend or bullish momentum.
Below 20 EMA: If the stock price is below the 20 EMA, it indicates a potential downtrend or bearish momentum.
Trendline: A trendline is a straight line drawn on a chart to represent the general direction of a data point set.
Uptrend Line: Drawn by connecting the lows in an upward trend. Indicates that the price is moving higher over time. Acts as a support level, where prices tend to bounce upward.
Downtrend Line: Drawn by connecting the highs in a downward trend. Indicates that the price is moving lower over time. It acts as a resistance level, where prices tend to drop.
RSI: RSI readings greater than the 70 level are overbought territory, and RSI readings lower than the 30 level are considered oversold territory.
Combining RSI with Support and Resistance:
Support Level: This is a price level where a stock tends to find buying interest, preventing it from falling further. If RSI is showing an oversold condition (below 30) and the price is near or at a strong support level, it could be a good buy signal.
Resistance Level: This is a price level where a stock tends to find selling interest, preventing it from rising further. If RSI is showing an overbought condition (above 70) and the price is near or at a strong resistance level, it could be a signal to sell or short the asset.
Disclaimer:
I am not a SEBI registered. The information provided here is for learning purposes only and should not be interpreted as financial advice. Consider the broader market context and consult with a qualified financial advisor before making investment decisions.

GICRE - BreakoutThis is breaking out or previous high - 20 EMA is crossing 50 EMA at a 2 hour time frame which is decent enough for Swing Trading, And on a similar Time Frame - it's crossing 200 EMA as well with a very high volume - Let's see if this learning helps.
P.S> - this is just my self learning and no recommendation - I am no registered anywhere or have not cleared any exam. Thanks,


GICRE GICRE Reinsurer ..
Will it Reinsure its earlier Price Level ??
600 or 350 ??
No Recommendations. Just Watch it !!

GICRE approaching breakout!!!If a stock is consolidating near its resistance for too long, sooner or later, it will break it for sure!
We've a perfect entry level!
Study invalid if stock breaks below 200ema!

GENERAL INSURANCE CORPORATION S/RSupport and Resistance Levels:
Support Levels: These are price points (green line/shade) where a downward trend may be halted due to a concentration of buying interest. Imagine them as a safety net where buyers step in, preventing further decline.
Resistance Levels: Conversely, resistance levels (red line/shade) are where upward trends might stall due to increased selling interest. They act like a ceiling where sellers come in to push prices down.
Breakouts:
Bullish Breakout: When the price moves above resistance, it often indicates strong buying interest and the potential for a continued uptrend. Traders may view this as a signal to buy or hold.
Bearish Breakout: When the price falls below support, it can signal strong selling interest and the potential for a continued downtrend. Traders might see this as a cue to sell or avoid buying.
20 EMA (Exponential Moving Average):
Above 20 EMA: If the stock price is above the 20 EMA, it suggests a potential uptrend or bullish momentum.
Below 20 EMA: If the stock price is below the 20 EMA, it indicates a potential downtrend or bearish momentum.
Trendline: A trendline is a straight line drawn on a chart to represent the general direction of a data point set.
Uptrend Line: Drawn by connecting the lows in an upward trend. Indicates that the price is moving higher over time. Acts as a support level, where prices tend to bounce upward.
Downtrend Line: Drawn by connecting the highs in a downward trend. Indicates that the price is moving lower over time. It acts as a resistance level, where prices tend to drop.
RSI: RSI readings greater than the 70 level are overbought territory, and RSI readings lower than the 30 level are considered oversold territory.
Combining RSI with Support and Resistance:
Support Level: This is a price level where a stock tends to find buying interest, preventing it from falling further. If RSI is showing an oversold condition (below 30) and the price is near or at a strong support level, it could be a good buy signal.
Resistance Level: This is a price level where a stock tends to find selling interest, preventing it from rising further. If RSI is showing an overbought condition (above 70) and the price is near or at a strong resistance level, it could be a signal to sell or short the asset.
Disclaimer:
I am not a SEBI registered. The information provided here is for learning purposes only and should not be interpreted as financial advice. Consider the broader market context and consult with a qualified financial advisor before making investment decisions.

GICRE Make Cup with Handle Pattern...NSE:GICRE trade at 420. You can watch for 600-650 after breakout.

SWING IDEA - GICREStock has made a MACD Cross this week on the Weekly Chart. This crossover can take the stock easily to its Swing High levels again.
The coming week could take the stock to a good move upward if the Market condition remains to be good.
Take entries only after the Market sentiments are favoring.

GICRE GIVES BRAKEOUT ON DAILY CHARTNSE:GICRE
GICRE Gives brake out on daily chart
Buy near 385
SL 350
Target 450
Time duration 1 month

GICRE - Swing Trade 17% ROI Potential1) Stock is reversing from a 6 weeks old consolidation at a major weekly support - Previous low.
2) Stock is in uptrend
3) Daily is showing Bullish RSI Divergence.
4) Daily Price indicates compression Breakout as well.
My entry - 350
Target - 400
SL - 325
RR - 1:2

GENERAL INSURANCE 1DAYBreakout has done.
.
.
.
.
.
I Am Not SEBI Registered Analyst. All Post and Levels Posting is only for educational and knowledge purpose. I Am not responsible for your any kind of loss or profit.
No Claim, All Rights Reserved.‼️
