price is at important level, wait for the breakout.we can see good move,in upcoming session, take decision after clear direction.
GLENMARK trade ideas
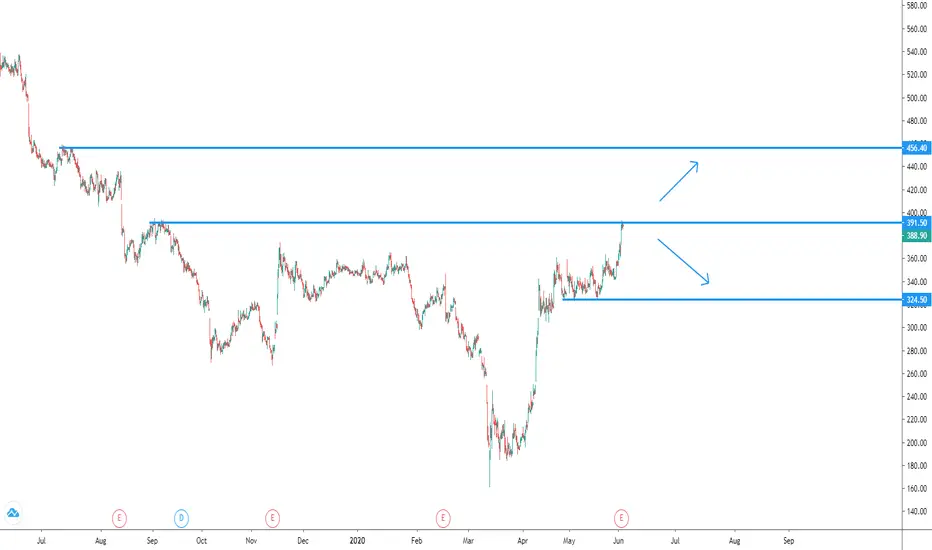
A BO above 366 can take Glenmark to 396.A strong BO above Rs 366 can take Glenmark to Rs 396 and further.
Observe the weekly volume build up in last 6 weeks. After a strong recovery from Rs 160 levels, the price has flew with tremendous volume to Rs 350 levels.
Observe the tight price consolidation in last 4 weeks with relatively less volume action.
% Delivery Qty to Traded Qty is increased in last 3 days( not plotted in chart).

GLENMARKThe pattern formed is good, and can be a long above 363.50 for a target of 376 and 390. Sl can be your entry level.


Short Glen markShort Glenmark on basis of 2618 Trade
Entry, Stop loss and target price are mentioned in chart.


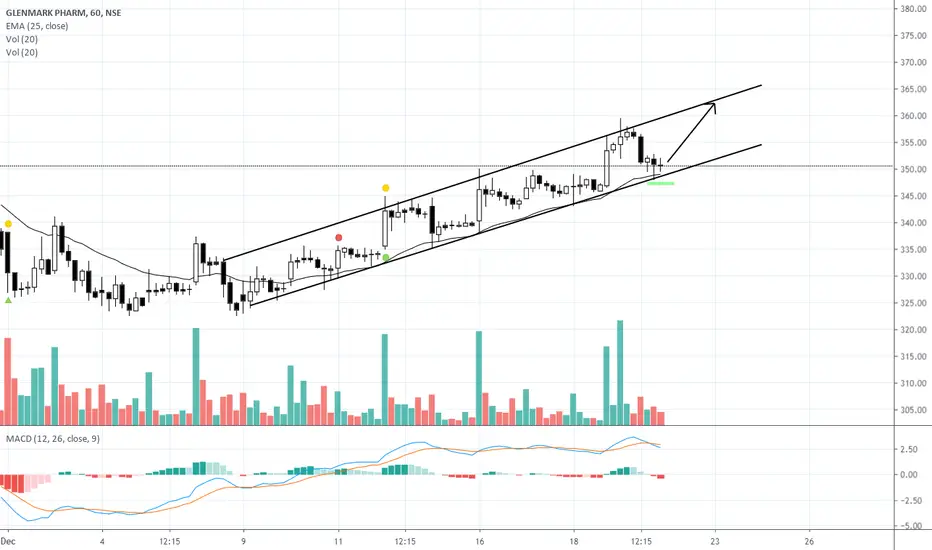
GLENMARK PHARMA_LONG IF STOCK CLOSES ABOVE TREND LINE WITH GOOD VOLUME THEN LONG POSITIONS NEED TO BE TAKEN

sell below 344.30 for safe trade also 5+ confirmation go short sell below 344.30 for safe trade also 5+ confirmation go short
follow for more


A Clear case of A Teacup in Glenmark PharmaIt has completed the cup and the handle is being formed. So expect it to go down. Did a bit of shorting intraday on thursday and made a profit.
Looking to enter Longs for a short term after completion of the Pullback.


Flag Pattern developed > Possible Upside BreakoutFLAG is a continuation pattern .
According to Thomas Bulkowski's Index, Flag has a very high successful winning rate.
Watch the following:
Flag is a short term consolidation pattern
Sharp price advancement after breakout
A possible Upside Breakout is on the way.


Glenmark : More fall expectedGlenmark broke the previous support level. and there is a wonderful divergence seen, so more PAIN anticipated in this counter.

GLENMARK CREATED HEAVY DEMAND LAST TIME IN THIS DEMAND ZONEIn the short-term, the stock may try to bounce back. It finds immediate support at ₹275 and a crucial one at ₹267. A close below the latter could trigger another bout of selling that could drag Glenmark Pharma below the ₹230 level. On the other hand, according to gann theory 1 unit of price/day = the motion of the earth around the sun such as we can see in the chart. but it will take some time for price and time balancing.


view on Glenmarkbuy above 380on closing basis for upmove.
if it doesnt sustain and fails to breakout will take time like slug.

Fibbonacci LevelsGlenmark is share which rebounces to fibbonacci 0.5 from bottom after long down trend , consolidation it is showing some recovery.
Previous years have shown it jumps till 0.5 levels of fib


GLENMARK Positional buyI am not a registered SEBI analyst. View expressed here are not meant to be a trading tip. It is purely educational.Please consult your personal financial advisor before investing. I am not responsible for your gains or losses.
