GMBREW ANALAYSIS LONG TERMThanks for stopping by.
All analysis here is done strictly from an investor’s perspective — focusing on risk, return, valuation, and potential upside.
The notes cover key details. I’ve backed every thesis with my own analysis — no fluff, just what matters to investors.
If you find the idea useful
Next report date
—
Report period
—
EPS estimate
—
Revenue estimate
—
56.90 INR
1.29 B INR
6.37 B INR
5.62 M
About G M BREWERIES LTD
Sector
Industry
CEO
Jimmy William Almeida
Website
Headquarters
Mumbai
Founded
1981
ISIN
INE075D01018
FIGI
BBG000CRCKJ8
G.M. Breweries Ltd. engages in the manufacture and sale of country liquor. It operates through G.M.Santra, G.M.Doctor, G.M.Limbu Punch, and G.M.Dilbahar Sounf brand names. The company was founded by Jimmy William Almeida on December 9, 1981 and is headquartered in Mumbai, India.
Related stocks

GMBREW CMP 660.GMBREW is a strong fundamental company with- PE = 10, PRICE to Book Value less than 2,Debt equal zero. ROCE and ROE around 20%. consistent net profit gainer every year. In this correction it trading at a best valuable price.And around 35% discount from last high.For long term player it is a best op

GM Breweries - Positional Trade Idea
📈 Breakout Setup
GM Breweries breaks above crucial resistance near ₹860 with increasing volume.
Entry: ₹862+
Target 1: ₹920
Target 2: ₹970
Stop-loss: ₹820
RSI at 64 indicates strong momentum. Watch for follow-through buying above the breakout level.
#GMBreweries #BreakoutTrade #PositionalTrade #

G M BREWERIES Breakout happend in this stock with rising 200dma and RS indicator is also showing strength.
Keep your risk and reward ratios according to your own preferance.
This is for educational purpose, do your own research before investing.

GMBREW potential breakout - 3 months base.
- Trading in a narrow range.
- Low risk entry point.
- Near base highs.
- Strong sector (Alcohol)

GM BREWERIES - TECHNICALS plus FUNDAMENTALS - A STOCK TO INVESTINVESTMENT PICK of the year -- MONTHLY TIME FRAME BREAKOUT 🚀🚀
TECHNICAL VIEW
Overall view - - Technically this stock has given a shiny breakout in Monthly Time Frame of downward sloping trendline which suggest the stock have more potential and more bias upside.
Again, As per Elliot Wave theory

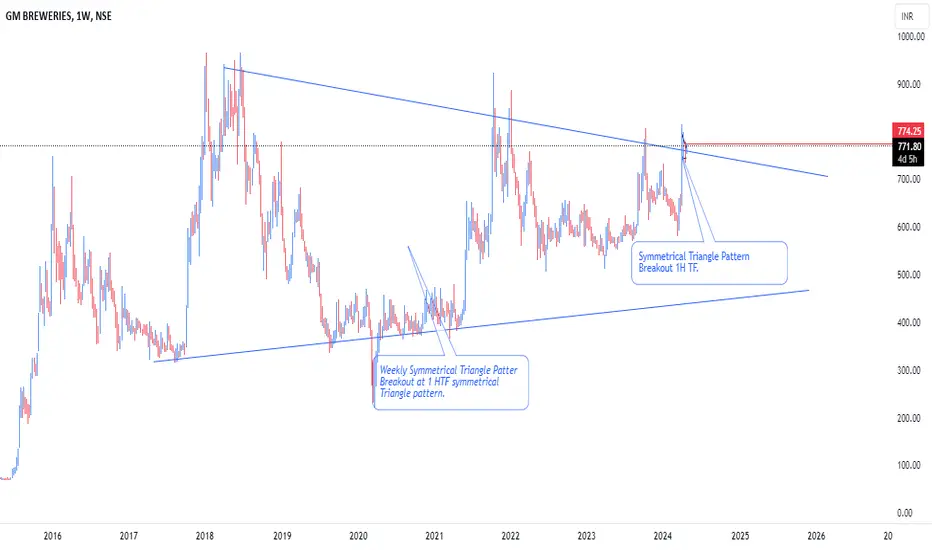
GM BREWERIES - POTENTIAL 6 YR BREAKOUTHas been forming a symmetrical triangle and a breakout with close above 700 in this time frame would activate the potential target of 1300
As long as it holds abv the stop loss level of 630, I believe this stock can hit 1000 by year end spilling the balance potential over next year
Disclaimer: Th

Symmetrical Triangle Breakout Symmetrical Triangle Breakout after 6 years of consolidation and 1TF also made Symmetrical Triangle Breakout
GM BREWERIES
GM BREWERIES is showing a good cup and handle pattern, and it recently reported strong quarterly results

Long GM brewGolden crossover done. Alcohol industry is booming.
Also Rsi breakout done . Volumes been up. Marked a tight stoploss and targets in the chart .
Follow for more.

See all ideas
Summarizing what the indicators are suggesting.
Oscillators
Neutral
SellBuy
Strong sellStrong buy
Strong sellSellNeutralBuyStrong buy
Oscillators
Neutral
SellBuy
Strong sellStrong buy
Strong sellSellNeutralBuyStrong buy
Summary
Neutral
SellBuy
Strong sellStrong buy
Strong sellSellNeutralBuyStrong buy
Summary
Neutral
SellBuy
Strong sellStrong buy
Strong sellSellNeutralBuyStrong buy
Summary
Neutral
SellBuy
Strong sellStrong buy
Strong sellSellNeutralBuyStrong buy
Moving Averages
Neutral
SellBuy
Strong sellStrong buy
Strong sellSellNeutralBuyStrong buy
Moving Averages
Neutral
SellBuy
Strong sellStrong buy
Strong sellSellNeutralBuyStrong buy
Displays a symbol's price movements over previous years to identify recurring trends.
Frequently Asked Questions
The current price of GMBREW is 691.25 INR — it has decreased by −1.57% in the past 24 hours. Watch G M BREWERIES LTD stock price performance more closely on the chart.
Depending on the exchange, the stock ticker may vary. For instance, on NSE exchange G M BREWERIES LTD stocks are traded under the ticker GMBREW.
GMBREW stock has fallen by −5.86% compared to the previous week, the month change is a −8.65% fall, over the last year G M BREWERIES LTD has showed a −12.50% decrease.
GMBREW reached its all-time high on Sep 17, 2024 with the price of 1,049.00 INR, and its all-time low was 1.25 INR and was reached on Aug 11, 1999. View more price dynamics on GMBREW chart.
See other stocks reaching their highest and lowest prices.
See other stocks reaching their highest and lowest prices.
GMBREW stock is 3.72% volatile and has beta coefficient of 1.58. Track G M BREWERIES LTD stock price on the chart and check out the list of the most volatile stocks — is G M BREWERIES LTD there?
Today G M BREWERIES LTD has the market capitalization of 15.57 B, it has decreased by −1.61% over the last week.
Yes, you can track G M BREWERIES LTD financials in yearly and quarterly reports right on TradingView.
G M BREWERIES LTD is going to release the next earnings report on Oct 9, 2025. Keep track of upcoming events with our Earnings Calendar.
GMBREW net income for the last quarter is 258.60 M INR, while the quarter before that showed 604.60 M INR of net income which accounts for −57.23% change. Track more G M BREWERIES LTD financial stats to get the full picture.
Yes, GMBREW dividends are paid annually. The last dividend per share was 7.50 INR. As of today, Dividend Yield (TTM)% is 1.10%. Tracking G M BREWERIES LTD dividends might help you take more informed decisions.
G M BREWERIES LTD dividend yield was 1.20% in 2024, and payout ratio reached 13.28%. The year before the numbers were 1.11% and 8.44% correspondingly. See high-dividend stocks and find more opportunities for your portfolio.
As of Aug 4, 2025, the company has 373 employees. See our rating of the largest employees — is G M BREWERIES LTD on this list?
EBITDA measures a company's operating performance, its growth signifies an improvement in the efficiency of a company. G M BREWERIES LTD EBITDA is 1.17 B INR, and current EBITDA margin is 18.94%. See more stats in G M BREWERIES LTD financial statements.
Like other stocks, GMBREW shares are traded on stock exchanges, e.g. Nasdaq, Nyse, Euronext, and the easiest way to buy them is through an online stock broker. To do this, you need to open an account and follow a broker's procedures, then start trading. You can trade G M BREWERIES LTD stock right from TradingView charts — choose your broker and connect to your account.
Investing in stocks requires a comprehensive research: you should carefully study all the available data, e.g. company's financials, related news, and its technical analysis. So G M BREWERIES LTD technincal analysis shows the sell today, and its 1 week rating is neutral. Since market conditions are prone to changes, it's worth looking a bit further into the future — according to the 1 month rating G M BREWERIES LTD stock shows the buy signal. See more of G M BREWERIES LTD technicals for a more comprehensive analysis.
If you're still not sure, try looking for inspiration in our curated watchlists.
If you're still not sure, try looking for inspiration in our curated watchlists.