GNFC On the wayThis is only for educational purpose , This is not for buy/sell recommendation .
I am not SEBI Registered.
looking good above 600
GNFC trade ideas

Key Support / Resistance Breakout - Swing TradeDisclaimer: I am not a Sebi registered adviser.
This Idea is publish purely for educational purpose only before investing in any stocks please take advise from your financial adviser.
Key Support & Resistance Breakout. Stock has give Breakout of Resistance level. Keep in watch list. Buy above the high. Suitable for Swing Trade. Stop loss & Target Shown on Chart.
Be Discipline because discipline is the Key to Success in the STOCK Market.
Trade What you see not what you Think.

GNFC--buy on dipwe are in last leg of correction every dip to be bought into for multiple return LRHR stock. 4th wave might end soon , once breaks out of contracting triangle will show more power

GNFC Ltd view for Intraday 3rd October #GNFC GNFC Ltd view for Intraday 3rd October #GNFC
Buying may witness above 703
Support area 693. Below ignoring buying momentum for intraday
Selling may witness below 693
Resistance area 700-703
Above ignoring selling momentum for intraday
Charts for Educational purposes only.
Please follow strict stop loss and risk reward if you follow the level.
Thanks,
V Trade Point

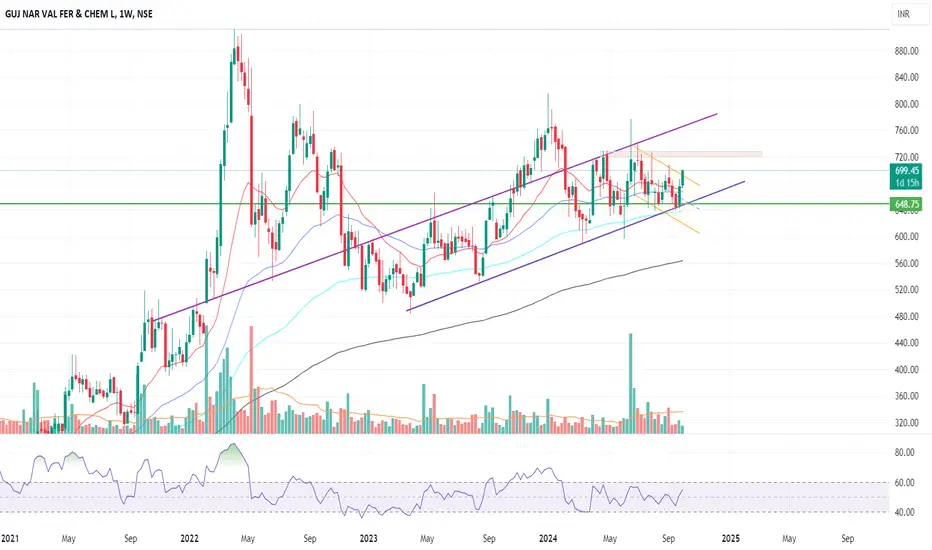
GNFC Weekly Chart AnalysisThe stock is trading within a long-term upward sloping channel , indicating a sustained uptrend. It recently bounced off the support level of 648.75, which aligns with the lower boundary of the channel, showing strong demand at this level. Additionally, the stock has broken out of a falling wedge pattern , typically signaling a bullish reversal.
Key technicals:
The price is above the 50, 100, and 200-week moving averages , suggesting a positive long-term trend.
RSI is neutral at around 50, with a slight upward tilt, indicating potential for further upside momentum.
Resistance: The stock faces a key resistance around 720, a breakout above which could lead to a test of the 760-780 levels.
A sustained move above 720 will confirm strength, while 648 remains an important support zone. Overall, the trend remains bullish , and traders should watch for further confirmation through volume and momentum indicators.


GNFC Ready to MOVE and will give Unbeatenable Returns 1st Target is 30%
2nd Target is 70%
and will hold for long term as well to get good risk reward ratio.
Note : This is only purely for educational purpose and i am not an SEBI Registered

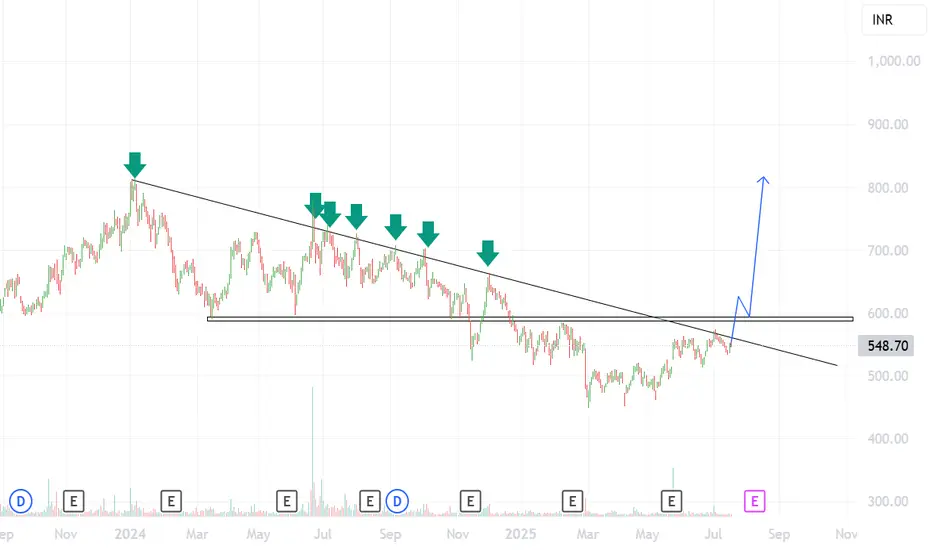
gnfc share for swing tradegnfc share is break down trend channel in short term. if it go up then firs target 740+.stop loss also mentioned in chart

Breakout?Do you think this stock is poised for a breakout, or could it see a rejection at this level? Interested to hear your thoughts on whether it's a good time to enter or wait for confirmation!"

GNFCGNFC Looking good for Symmetrical Triangle Breakout...
Confirmation - closing above 703
Target - 900++
SL lower 📈
Disclaimer - I am not SEBI Registered Analyst. Before doing anything please consult your financial advisor.

GNFC all geared up!!!Another stock ready to fly!
A breakout above the trendline may take the stock to new heights!

GNFC LTD S/RSupport and Resistance Levels:
Support Levels: These are price points (green line/share) where a downward trend may be halted due to a concentration of buying interest. Imagine them as a safety net where buyers step in, preventing further decline.
Resistance Levels: Conversely, resistance levels (red line/shade) are where upward trends might stall due to increased selling interest. They act like a ceiling where sellers come in to push prices down.
Breakouts:
Bullish Breakout: When the price moves above resistance, it often indicates strong buying interest and the potential for a continued uptrend. Traders may view this as a signal to buy or hold.
Bearish Breakout: When the price falls below support, it can signal strong selling interest and the potential for a continued downtrend. Traders might see this as a cue to sell or avoid buying.
20 EMA (Exponential Moving Average):
Above 20 EMA: If the stock price is above the 20 EMA, it suggests a potential uptrend or bullish momentum.
Below 20 EMA: If the stock price is below the 20 EMA, it indicates a potential downtrend or bearish momentum.
Trendline: A trendline is a straight line drawn on a chart to represent the general direction of a data point set.
Uptrend Line: Drawn by connecting the lows in an upward trend. Indicates that the price is moving higher over time. Acts as a support level, where prices tend to bounce upward.
Downtrend Line: Drawn by connecting the highs in a downward trend. Indicates that the price is moving lower over time. It acts as a resistance level, where prices tend to drop.
RSI: RSI readings greater than the 70 level are overbought territory, and RSI readings lower than the 30 level are considered oversold territory.
Combining RSI with Support and Resistance:
Support Level: This is a price level where a stock tends to find buying interest, preventing it from falling further. If RSI is showing an oversold condition (below 30) and the price is near or at a strong support level, it could be a good buy signal.
Resistance Level: This is a price level where a stock tends to find selling interest, preventing it from rising further. If RSI is showing an overbought condition (above 70) and the price is near or at a strong resistance level, it could be a signal to sell or short the asset.
Disclaimer:
I am not a SEBI registered. The information provided here is for learning purposes only and should not be interpreted as financial advice. Consider the broader market context and consult with a qualified financial advisor before making investment decisions.

GNFC, Bullish, Kindly do your own studyThis stock is ready to fly for bulls.
Monthly price is above 50 EMA and Upper half of BB.
Monthly MACD has given uptick
Weekly price is above 50 EMA and took support of 50 EMA and printed Hammer. Hammer at 50 EMA support.
Weekly MACD has given positive crossover above zero line
Daily price is above 50 EMA and big bullish candle at 50 EMA support.
Price retraced 62% of previous rally.
Volume is also good
Daily MACD is up and made hook.
Daily RSI is above 50 level.
+DI is greater than -DI

GNFC - Impressive setupStock has formed pattern within pattern with a heavy volume of late.
Aggressive Entry - It has given the Handle breakout targetting 786-800 for which the stock has to maintain abv 660
Conservative Entry - BO above 786/800 lvl with convincing volume will confirm both
1. Triangle pattern BO and
2. Cup & Handle Neck BO
in which case the targets that the stock can likely work off would be 900, 1128 and 1300
Disclaimer: This idea is for education/information purpose only and does not constitute any trading recommendation. Please do your own research or consult a SEBI approved analyst before making investment decision

GNFC 1WEEKReady to breakout.
I Am Not SEBI Registered Analyst. All Post and Levels Posting is only for educational and knowledge purpose. I Am not responsible for your any kind of loss or profit.
No Claim, All Rights Reserved.‼️

sell at zone ~ intradayexpecting small fall from the zone . look for confirmation inside zone in smaller tf.
- good for intraday trade
- entry inside zone
- sl is day close above zone
- for target draw fib retracement from C to latest swing high , use 0.236 fib as tgt 1 (safe place for intraday), 0.382 as tgt 2 (risk takers).
- don't trade , if u didn't get selling confirmation inside zone
- if day close is above this zone , this pattern becomes invalid.

GNFC SwingSwing trading entry opportunity is there. Upside move expected up to the resistance level.


Unleashing Profits: A Deep Dive into the Promising Opportunity iIntroduction
In a world where finding an edge in the market can make all the difference, we've identified a compelling opportunity with the GNFC stock currently trading on the National Stock Exchange (NSE) at its current market price (CMP) of Rs.619. This isn't just a hunch; our analysis suggests that there are strong reasons to believe that this stock is poised for significant growth. Let's delve deeper into why we're bullish about GNFC and what potential gains investors might expect from this stock.
Weekly Trendline Support
The first sign of promise comes from the fact that the stock price has bounced off the weekly trendline, considered a robust support line. This indicates a possible reversal pattern, indicating that the stock may be ready to start a new upward trend.
Fibonacci Retracement Levels
Our technical analysis reveals that the stock price has reached a critical point, with the fibonacci retracement levels suggesting a potential breakout. Specifically, the fibonacci level of 0.236, which falls between Rs.644 and Rs.650, is a key resistance level on both the daily and weekly timeframes. This means that if the stock price manages to breach these levels, it could potentially lead to a significant surge in value.
Daily Timeframe Resistance Trendline
Adding to the bullish sentiment, the daily timeframe resistance trendline, marked by a long candle and high volume, aligns closely with the fibonacci level mentioned above. This confluence of indicators strengthens the case for a potential upswing in the stock price, particularly if the stock can close above these levels.
Downside Potential
Of course, no investment is without risk. Should the stock price dip below Rs.600, it would present another intriguing opportunity for those looking to short the stock. However, given the strength of the support lines and the potential for a breakout above the fibonacci levels, we remain optimistic about the overall outlook for GNFC.
Conclusion
With a well-defined edge in sight, we believe that GNFC presents a promising opportunity for investors seeking to capitalize on the stock market's movements. As always, it's crucial to exercise caution and carefully consider your investment strategy before making any decisions. Stay tuned for more insights and updates on this exciting development in the world of stocks.

Buy above 650
1 : Stock is near very good support in weekly timeframe
2: Highly volatile stock once price will reject from lover level and than weekly pattern is similar to cup and handle .
3:expected reversal on the base of indicator

Close above 667 we can see 700 levels short termBuy above 667 for a target of 700 we can see the rounding bottom, close above 667 one can go long for a target of 700.
