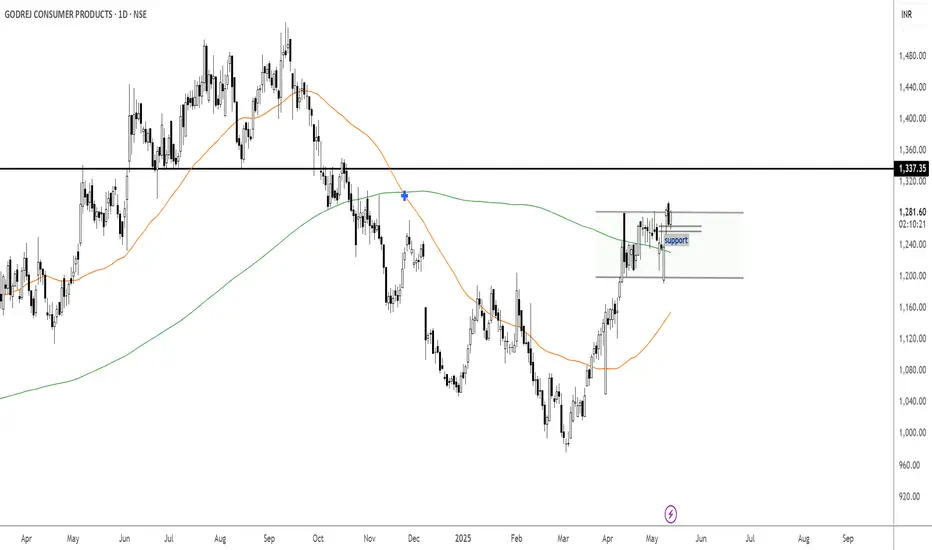
GodrejconsumerWith weekly gap as support it should do well in coming days.
gap should act as imp support.
GODREJCP trade ideas
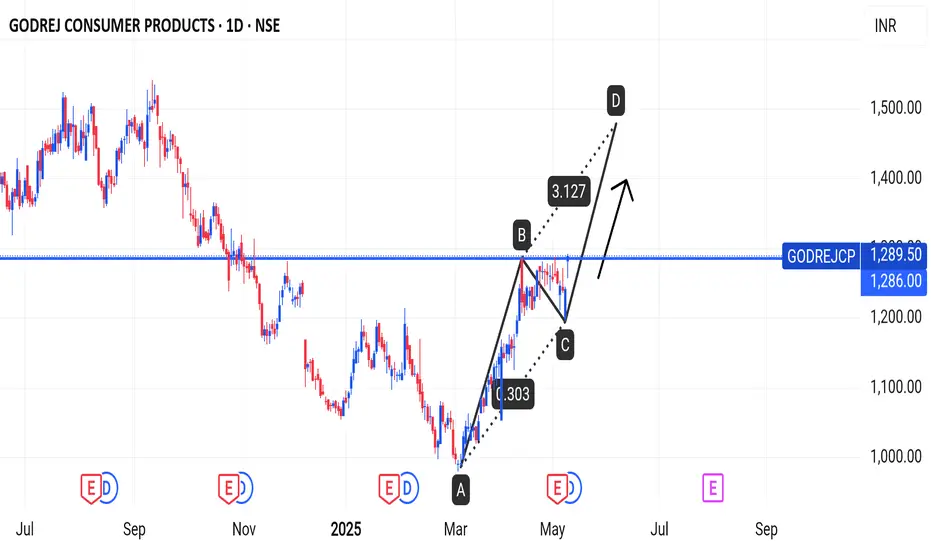
Godrej consumer products There is a strong uptrend from Point A to B, indicating a bullish movement.
From Point B to C, there is a minor correction (retracement), which is considered normal after a rally in a stock.
From Point C to D, a potential new bullish move is anticipated. The chart shows that the stock is at a breakout zone.
Current Price: ₹1289.50
Resistance Level: Around ₹1286, which has been breached potential breakout. indicating a
Godrej Consumer Product buy on vwap jab ta na aye mat kharedoGodrej Consumer Products Limited (GCPL) is a prominent Indian multinational corporation specializing in fast-moving consumer goods (FMCG). As a part of the over 125-year-old Godrej Group, GCPL has established a significant presence in both domestic and international markets.
**Key Details:**
- **Founded:** 2001
- **Headquarters:** Mumbai, Maharashtra, India
- **Chairperson:** Nisaba Godrej
- **Managing Director & CEO:** Sudhir Sitapati
**Core Business Segments:**
1. **Home Care:**
- Household insecticides
- Air care
- Fabric care
2. **Personal Care:**
- Soaps
- Hair care
- Skin care
**Key Brands:**
- **Cinthol:** A range of soaps, deodorants, and talcum powders.
- **Godrej No.1:** A popular soap brand in India.
- **Goodknight:** A leading mosquito repellent brand.
- **Hit:** Insect control products.
- **Ezee:** Liquid detergent for delicate fabrics.
- **Godrej Expert:** Hair color products.
**Global Presence:**
GCPL has expanded its footprint across various emerging markets, including regions in Asia, Africa, and Latin America. The company has achieved this through strategic acquisitions and partnerships, enhancing its product portfolio and market reach. ( [
**Sustainability Initiatives:**
GCPL is committed to sustainable and inclusive growth. The company focuses on environmental sustainability, social responsibility, and corporate governance. Initiatives include reducing carbon emissions, water conservation, and community development programs. Consumer Products
**Financial Highlights:**
As of the fiscal year ending March 31, 2024, GCPL reported revenues of approximately ₹140.96 billion. However, the company faced a net loss of ₹5.61 billion during the same period. The increase in selling, general, and administrative expenses contributed to this decline in net income.
**Recent Developments:**
In January 2024, GCPL launched 'Godrej Fab,' a liquid detergent, in the southern regions of India, marking its entry into the fabric care segment.
GCPL continues to focus on innovation, sustainability, and expanding its global presence to drive future growth.

Godrej Consumer Swing TradeHello,
Trend-Based Analysis. Buy the Dips, Sell The Rallies, Also Following the Trend. Let's see where the Price Action takes us, Riding the wave. Potential trade setups based on trend momentum.
Technical analysis based on trend identification and momentum, Looking for high-probability setups within the prevailing trend.
Analyzing the current market trend and potential future price movement. Focusing on risk management and reward-to-risk ratios.
Details is Mentioned in Chart, Read carefully.. .


Godrej Consumer Products Ltd view for Intraday 22nd Nov #GODREJCGodrej Consumer Products Ltd view for Intraday 22nd Nov #GODREJCP
Resistance 1200. Watching above 1202 for upside movement...
Support area 1160 Below 1180 ignoring upside momentum for intraday
Support 1160 Watching below 1158 for downside movement...
Resistance area 1200
Above 1180 ignoring downside move for intraday
Charts for Educational purposes only.
Please follow strict stop loss and risk reward if you follow the level.
Thanks,
V Trade Point

Godrej Consumer Products Ltd view for Intraday 21st Nov #GODREJCGodrej Consumer Products Ltd view for Intraday 21st Nov #GODREJCP
Resistance 1200. Watching above 1202 for upside movement...
Support area 1160 Below 1180 ignoring upside momentum for intraday
Support 1160 Watching below 1158 for downside movement...
Resistance area 1200
Above 1180 ignoring downside move for intraday
Charts for Educational purposes only.
Please follow strict stop loss and risk reward if you follow the level.
Thanks,
V Trade Point

Godrej Consumer Products- Ulat Reversal Mode - 3 months Buy Now Godrej Consumer Products- Ulat Reversal Mode - 3 months Buy Now
1) Stock in Consolidation Zone
2) It is at support level
3) Lets see how it performs.
Beware, It may reach lower support level as well.

GODREJ CPGodrej cp taken support and making highr low/high ,if it break nxt high it may go up for next resistance.but this one is at strong resistsnce zone for next trading session.

Godrej Consumer Products ltd view for Intraday 14th October #GODGodrej Consumer Products ltd view for Intraday 14th October #GODREJCP
Buying may witness above 1323
Support area 1305. Below ignoring buying momentum for intraday
Selling may witness below 1305
Resistance area 1320
Above ignoring selling momentum for intraday
Charts for Educational purposes only.
Please follow strict stop loss and risk reward if you follow the level.
Thanks,
V Trade Point

Codrej Consumer Products Ltd view for Intraday 7th October #GODRCodrej Consumer Products Ltd view for Intraday 7th October #GODREJCP
Buying may witness above 1355
Support area 1333-1335. Below ignoring buying momentum for intraday
Selling may witness below 1333
Resistance area 1350-1355
Above ignoring selling momentum for intraday
Charts for Educational purposes only.
Please follow strict stop loss and risk reward if you follow the level.
Thanks,
V Trade Point

Godrej Consumer Products ltd view for Intraday 1st October #GODRGodrej Consumer Products ltd view for Intraday 1st October #GODREJCP
Buying may witness above 1401
Support area 1390. Below ignoring buying momentum for intraday
Selling may witness below 1374
Resistance area 1390
Above ignoring selling momentum for intraday
Charts for Educational purposes only.
Please follow strict stop loss and risk reward if you follow the level.
Thanks,
V Trade Point

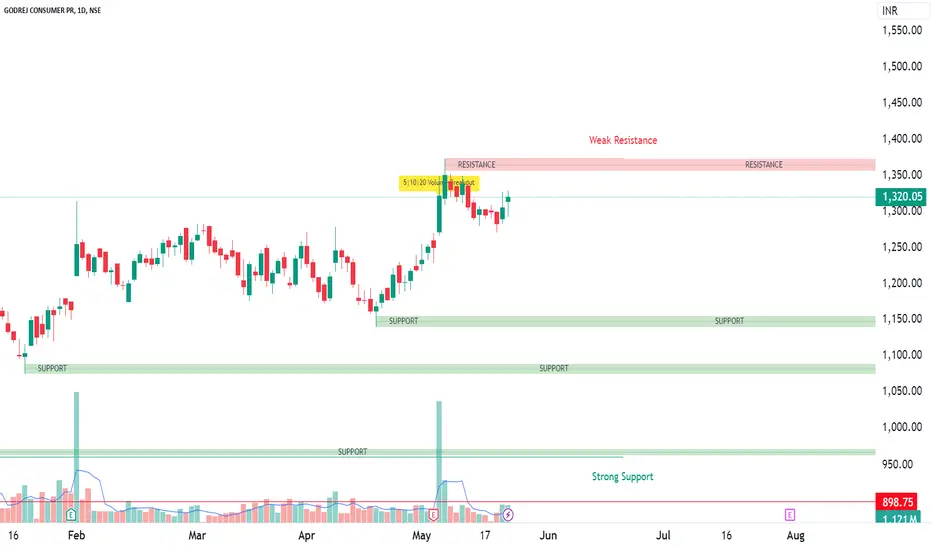
GODREJ CONSUMER S/R Support and Resistance Levels:
Support Levels: These are price points (green line/shade) where a downward trend may be halted due to a concentration of buying interest. Imagine them as a safety net where buyers step in, preventing further decline.
Resistance Levels: Conversely, resistance levels (red line/shade) are where upward trends might stall due to increased selling interest. They act like a ceiling where sellers come in to push prices down.
Breakouts:
Bullish Breakout: When the price moves above resistance, it often indicates strong buying interest and the potential for a continued uptrend. Traders may view this as a signal to buy or hold.
Bearish Breakout: When the price falls below support, it can signal strong selling interest and the potential for a continued downtrend. Traders might see this as a cue to sell or avoid buying.
20 EMA (Exponential Moving Average):
Above 20 EMA(50 EMA): If the stock price is above the 20 EMA, it suggests a potential uptrend or bullish momentum.
Below 20 EMA: If the stock price is below the 20 EMA, it indicates a potential downtrend or bearish momentum.
Trendline: A trendline is a straight line drawn on a chart to represent the general direction of a data point set.
Uptrend Line: Drawn by connecting the lows in an upward trend. Indicates that the price is moving higher over time. Acts as a support level, where prices tend to bounce upward.
Downtrend Line: Drawn by connecting the highs in a downward trend. Indicates that the price is moving lower over time. It acts as a resistance level, where prices tend to drop.
RSI: RSI readings greater than the 70 level are overbought territory, and RSI readings lower than the 30 level are considered oversold territory.
Combining RSI with Support and Resistance:
Support Level: This is a price level where a stock tends to find buying interest, preventing it from falling further. If RSI is showing an oversold condition (below 30) and the price is near or at a strong support level, it could be a good buy signal.
Resistance Level: This is a price level where a stock tends to find selling interest, preventing it from rising further. If RSI is showing an overbought condition (above 70) and the price is near or at a strong resistance level, it could be a signal to sell or short the asset.
Disclaimer:
I am not a SEBI registered. The information provided here is for learning purposes only and should not be interpreted as financial advice. Consider the broader market context and consult with a qualified financial advisor before making investment decisions.

Godrejcp Swing TradeBullish Engulfing at support zone. Once the high of this candle is broken one can enter in the stock with SL below the candle and can look for 1:3 RR trade. Please trade in Cash Market only no future recommendation.
Please consult with your advisor before taking any risk.

Godrej Consumer Products in breakoutGodrej Consumer Products BSE:GODREJCP in breakout. Buy above 1470 and Target would be 1720

GodrejCP for Positional BuyRefer the charts for Levels
Also look for Godrej Properties...about to have a breakout

Godrejcp: New Peaceful Strategy....Details of the screener + Process is updated here..
www.tradingview.com

Godrej Consumer Products UptrendGodrej consumer products may show Uptrend from here.
CMP : 1375
Target: 1450+

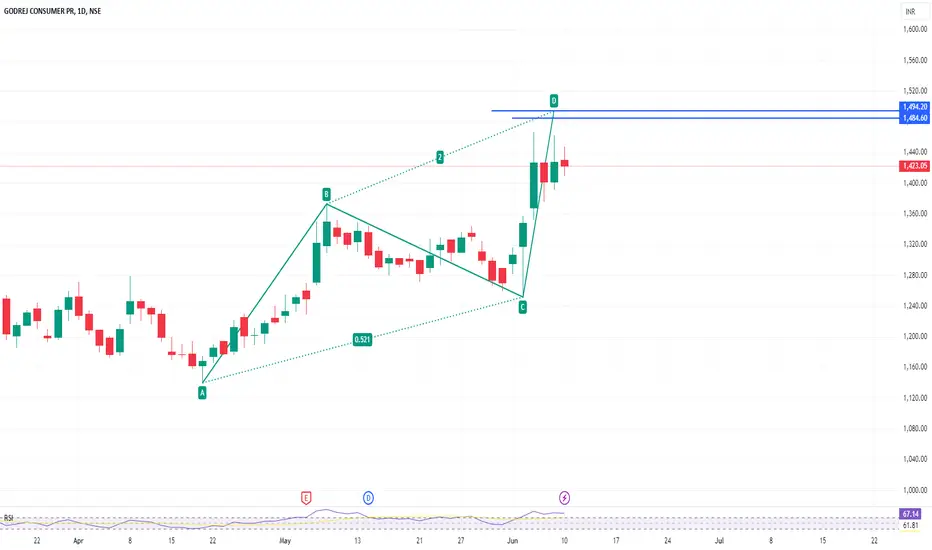
sell at zone ~ intradayexpecting small fall from the zone . look for confirmation inside zone in smaller tf.
- good for intraday trade
- entry is strictly inside the zone
- SL is day close above zone
- for target draw fib retracement from C to latest swing high , use 0.236 fib as tgt 1 (safe place for intraday), 0.382 as tgt 2 (risk takers).
- don't trade , if u didn't get selling confirmation inside zone
- if day close is above this zone , this pattern becomes invalid , ignore this pick
Godrejcp Intraday level for todayGodrejcp Intraday level for today #GODREJCP
Buying opportunity above 1435
Stop Loss area 1420
Charts for Educational purposes only.
Please follow strict stop loss and risk reward if you follow the level.
Thanks,
V Trade Point

GODREJCP Intraday level for today #GODREJCP GODREJCP Intraday level for today #GODREJCP
Buying opportunity above 1354
Stop Loss area 1340
Charts for Educational purposes only.
Please follow strict stop loss and risk reward if you follow the level.
Thanks,
V Trade Point

Consumer Durables timeThe consumer Durable Index is showing an upward trend, and one of the shares in this index is GODREJCP. Those looking for returns before the election results can consider this stock with a supported stop loss.

GODREJCP (Godrej Consumer Products Limited) - Swing tradeClosing Price: ₹1,320.05
Change %: 1.1%
Volume: 1,121,198
High: ₹1,329
Godrej Consumer Products saw a 1.1% rise with a relatively lower volume compared to the others. However, closing near its high suggests positive momentum. Given its strong brand presence and stable growth in the consumer goods sector, GODREJCP could continue to perform well in the short term.
Kindly conduct thorough analysis and consider market conditions before making any trading decisions.