GODREJ Industries Ready to Blast !! Short to Long term GODREJ Inndustries-----DAILY counts indicate Excellent bullish wave structure.
Both appear to be optimistic and this stock invalidation number wave 2 low
target short / long term are already shared as per charts
correction wave leg seems completed
Investing in declines is a smart move for short/ long-term players.
Buy in DIPS recommended
Long-term investors prepare for strong returns over the next two to five years.
one of best counter
Every graphic used to comprehend & LEARN & understand the theory of Elliot waves, Harmonic waves, Gann Theory, and Time theory
Every chart is for educational purposes.
We have no accountability for your profit or loss.
GODREJIND trade ideas

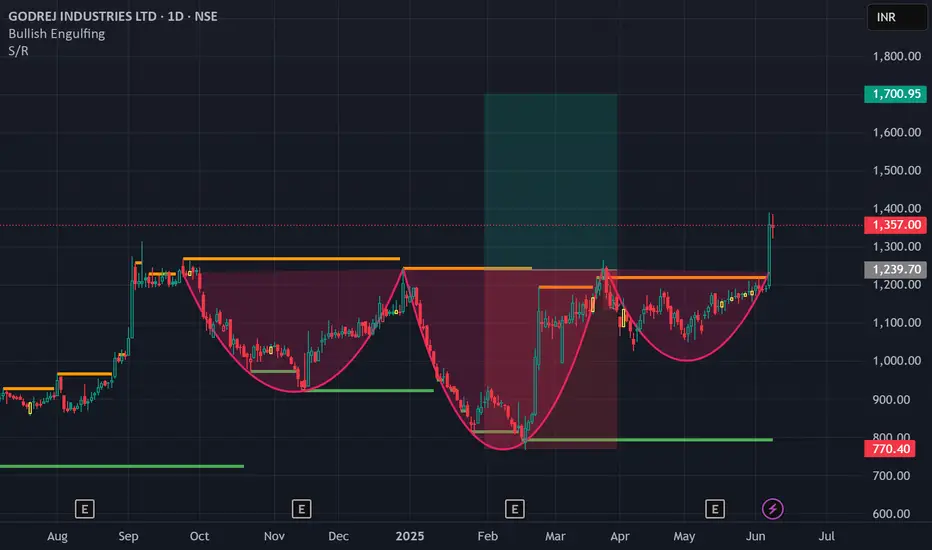
Godrej Industries Formed H&E PatternNSE:GODREJIND has formed Inverse Head and Shoulder Pattern. We could Target for 1700.
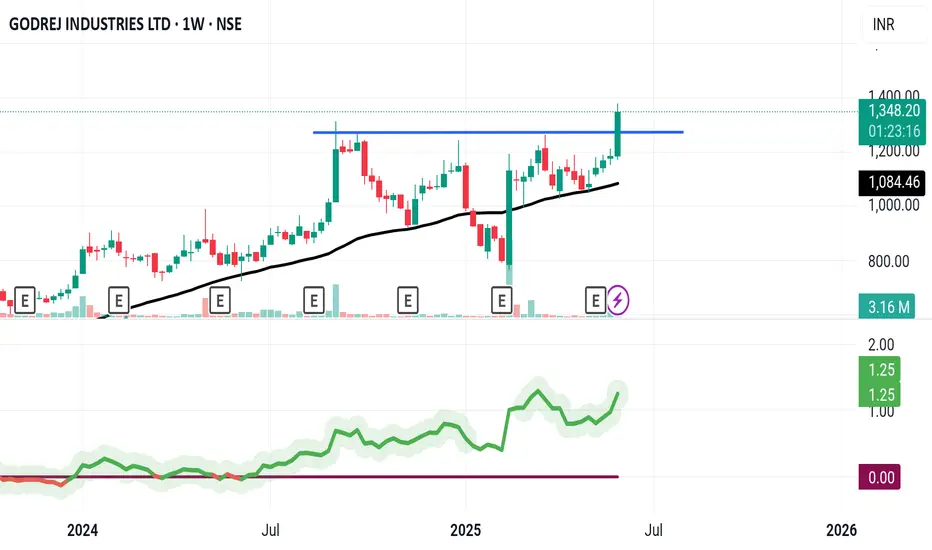
Godrej Industries Ltd Weekly Trend AnalysisGodrej Industries Ltd has broken out to a new all-time high, closing at 1359.50. The stock indicates a potential uptrend with likely targets at 1480 and 1717.
Traders are advised to carry out their own technical analysis before making any trading decisions.

GODREJ INDUSTRIES LTDBreakout happend in this stock with rising 200dma and RS indicator is also showing strength.
Keep your risk and reward ratios according to your own preferance.
This is for educational purpose, do your own research before investing.
Can Break the Supply Zone...?Godrej Industries limited face a heavy supply zone, If its break this time then its on all time high in BLUE SKY ZONE, and its next resistence is 1200-1300...

A trendline breakout monthly TFA trendline breakout of monthly TF.....sl closing below 909......Target 1772......buying zone 1038-1058.....Only for educational purpose and not any recommendation......I am not sebi registered Research analyst......

GODREJ INDUSTRIES LTD S/RSupport and Resistance Levels:
Support Levels: These are price points (green line/shade) where a downward trend may be halted due to a concentration of buying interest. Imagine them as a safety net where buyers step in, preventing further decline.
Resistance Levels: Conversely, resistance levels (red line/shade) are where upward trends might stall due to increased selling interest. They act like a ceiling where sellers come in to push prices down.
Breakouts:
Bullish Breakout: When the price moves above resistance, it often indicates strong buying interest and the potential for a continued uptrend. Traders may view this as a signal to buy or hold.
Bearish Breakout: When the price falls below support, it can signal strong selling interest and the potential for a continued downtrend. Traders might see this as a cue to sell or avoid buying.
20 EMA (Exponential Moving Average):
Above 20 EMA(50 EMA): If the stock price is above the 20 EMA, it suggests a potential uptrend or bullish momentum.
Below 20 EMA: If the stock price is below the 20 EMA, it indicates a potential downtrend or bearish momentum.
Trendline: A trendline is a straight line drawn on a chart to represent the general direction of a data point set.
Uptrend Line: Drawn by connecting the lows in an upward trend. Indicates that the price is moving higher over time. Acts as a support level, where prices tend to bounce upward.
Downtrend Line: Drawn by connecting the highs in a downward trend. Indicates that the price is moving lower over time. It acts as a resistance level, where prices tend to drop.
RSI: RSI readings greater than the 70 level are overbought territory, and RSI readings lower than the 30 level are considered oversold territory.
Combining RSI with Support and Resistance:
Support Level: This is a price level where a stock tends to find buying interest, preventing it from falling further. If RSI is showing an oversold condition (below 30) and the price is near or at a strong support level, it could be a good buy signal.
Resistance Level: This is a price level where a stock tends to find selling interest, preventing it from rising further. If RSI is showing an overbought condition (above 70) and the price is near or at a strong resistance level, it could be a signal to sell or short the asset.
Disclaimer:
I am not a SEBI registered. The information provided here is for learning purposes only and should not be interpreted as financial advice. Consider the broader market context and consult with a qualified financial advisor before making investment decisions.

Darvas Box Strategy -Breakout StockDisclaimer: I am Not SEBI Register adviser, please take advise from your financial adviser before investing in any stocks.
Stock has given break out buy above the High and do not forget to keep stop loss best suitable for swing trading.
Stop loss and Target Shown on the Chart T1 & T2.
Be Discipline, because discipline is the key to Success in Stock Market.
Trade what you See Not what you Think.

Swing Trade - GODREJIND📊 Script: GODREJIND
📊 Sector: Chemicals
📊 Industry: Chemicals
Key highlights: 💡⚡
📈 Script is trading at upper band of BB.
📈 MACD is giving crossover .
📈 Double Moving Averages are giving crossover.
📈 Right now RSI is around 64.
📈 One can go for Swing Trade.
⏱️ C.M.P 📑💰- 941
🟢 Target 🎯🏆 - 1000
⚠️ Stoploss ☠️🚫 - 908
⚠️ Important: Always maintain your Risk & Reward Ratio.
✅Like and follow to never miss a new idea!✅
Disclaimer: I am not SEBI Registered Advisor. My posts are purely for training and educational purposes.
Eat🍜 Sleep😴 TradingView📈 Repeat 🔁
Happy learning with trading. Cheers!🥂

Godrej Industries gives brakeout on daily chartNSE:GODREJIND
Godrej Industries gives brake out on daily chart.
I am buying this stock
Near 920-930
And follow sl on 830
My target will be 1080
My risk reward ratio is 1:1.60
Return on capital 15%+

GODREJ INDUSTRIES S/R for 25/6/24Support and Resistance Levels: In technical analysis, support and resistance levels are significant price levels where buying or selling interest tends to be strong. They are identified based on previous price levels where the price has shown a tendency to reverse or find support.
Support levels are represented by the green line and green shade, indicating areas where buying interest may emerge to prevent further price decline.
Resistance levels are represented by the red line and red shade, indicating areas where selling pressure may arise to prevent further price increases. Traders often consider these levels as potential buying or selling opportunities.
Breakouts: Breakouts occur when the price convincingly moves above a resistance level (red shade) or below a support level (green shade). A bullish breakout above resistance suggests the potential for further price increases, while a bearish breakout below support suggests the potential for further price declines. Traders pay attention to these breakout signals as they may indicate the start of a new trend or significant price movement.
Disclosure: I am not SEBI registered. The information provided here is for learning purposes only and should not be interpreted as financial advice. It is important to consult with a qualified financial advisor before making any investment decisions. Tweets neither advice nor endorsement.

swing pick - go long - this stock is picked after market close based on delivery qty data.
- follow this stock for next 5 days , if entry not triggered with in 5 days , ignore pick
- if price crosses today's high , go long
- keep candle low as sl , for tgt keep 1:1.5 Risk Reward

buy at zone - swing pickENTRY
- line marked is potential reversal zone ( PRZ)
- entry is strictly inside the zone
- look for buying confirmation in smaller time frame ( 15 minutes preferred )
EXIT
1. target
- mark fib retracement from C to latest swing low
- TGT 1 - 0.236
- TGT 2 - 0.382
- TGT 3 - 0.5 ( preferred target )
2. SL
- candle close below (PRZ)
- if candle close is below zone , this pattern becomes invalid . IGNORE THIS PICK
- RE-ENTRY can be done , if u again get buying confirmation inside the zone

Godrej IND Swing future Based on VCP strategy with some modifications.
Buy Swing minimum Target 5% , and maybe big candle posible ( according to backtest data)
( Im just reversal trader from last 4year , but I try to move on trend follow. Reason.
In reversal stock consolidation avg 3-6 months avg so my money stuck it.
Trend and movement stock give return or sl in just few days to weeks)
I have backtested around 10 stock avg last 3/5 year data show accuracy 80%.
Still in testing mode .

GODREJ INDUSTRIES The stock has now successfully taken out the Rejection Zone with consecutive Bullish Effort to Move up Bars. Quality Buying seen with increased Delivery volumes. RS and Money Flow has be strong for some time. The stock likely to move higher now . A test of the Rejection Zone is also possible before the up move.

CUP and Handle Breakout in GODREJINDThere is a cup and handle breakout and stock is retesting support zone of 800 ready 1080 targets soon.

Godrej industries to riseGodrej Industries is poised for an upward trajectory from its current price, driven by evident bullish momentum. The prevailing market sentiment is optimistic, and the stock's performance suggests a favorable outlook.

GODREJ INDUSTRIES SWING TRADE IDEAGODREJ INDUSTRIES gave 52 weeks high breakout with gud volume bar and made new all time high closed with inverted hammer candle can play this fow swing trade once it gives close abv inverted hammer candles high with your prefered RR.


Inverted Head and Shoulders in Weekly Chart of GODREJiNDInverted Head and Shoulders pattern in Godrej Industries in Weekly Chart. Its an Multi Year Breakout.


GodrejindThese are swing idea's which you can add your watchlist and analysis for yourself.
Keep on radar.
Potential upside stock!

