GRANULES india ltd - short term trend - bearishaccording to EWP analysis, Granules india Ltd
from the bottom of 422 to 547 price has unfolded in Flat correction
wave (B) retraced wave (A) X more than 78.6%
Wave(C) projected wave (A) X 1.618%
from the top of 547 to 478 is impulsive wave (1)
from 478 to 511 price is unfolded in extended flat corrective wave format.
from price 511 to down trend is identified as wave(3) in progress
followed expecting impulsive wave towards down trend or another correction resulting in complex correction.
target for impulsive wave(3) would be 400 -wave(A) X1.618%
GRANULES trade ideas

Granules - Looking Beautifull structure - short to long investorGranules -----Daily counts indicate Excellent bullish wave structure.
Both appear to be optimistic and this stock invalidation number (S L) wave 2 low
target short / long term are already shared as per charts
correction wave leg seems completed C
Investing in declines is a smart move for short/ long-term players.
Buy in DIPS recommended
Long-term investors prepare for strong returns over the next two to five years.
one of best counter
Every graphic used to comprehend & LEARN & understand the theory of Elliot waves, Harmonic waves, Gann Theory, and Time theory
Every chart is for educational purposes.
We have no accountability for your profit or loss.

Granules India Swing TradeGranules India Swing Trade
Entry- 703/-
Target - 983/- (40%)
Time Frame - 4 to 8 weeks

GRANULES 1HRThe combination of waves (W), (X), and (Y) suggests a Double Zigzag pattern, a common type of complex correction.
Current Situation and Potential Outlook:
* Wave (C) of (Y): The chart labels the final wave down as (C), which is consistent with an impulsive wave.
* MACD and Williams %R: The MACD is below the zero line, indicating bearish momentum. The Williams %R is at the bottom (-100), suggesting the market is oversold.
* Potential Reversal: The oversold condition on Williams %R, combined with the completion of a potential five-wave impulsive move in (Y), suggests a potential reversal or at least a corrective bounce is likely.
* Confirmation Needed: To confirm a reversal, we need to see a break above the corrective channel (if one exists) and a sustained move above the recent swing highs.
Important Considerations:
* Alternative Counts: Elliott Wave analysis is subjective, and there could be alternative valid interpretations.
* Timeframe: This analysis is based on a 1-hour chart. Longer timeframes might provide a broader perspective.
* Fundamental Analysis: Elliott Wave analysis should be used in conjunction with fundamental analysis for a more comprehensive view.
In summary, the chart suggests a completed complex correction (Double Zigzag) with a potential for a reversal or bounce.

Granules for the down-run in Sept monthPharma Sector looks in a pressure for a down move and we can see Granules following downtrend despite overall market towards upside. It would be good to go with hedge position of Shorting 300CE and Buying 330Ce for hedging.

Granuels : breaking out of consolidation ?Granuels : breaking out of consolidation ?
cmd 605
Sl 588
Target 628, 700 if it breaks 628 then good upside momentum
PE < industry PE
Strictly for educational purpose and not a buy sell recommmendation

How to use Trading View - Part 2 - Drawings and AlertsHow to use Trading View - Part 2 - Drawings and Alerts
Remember to assign different colours to different Time Frames as we saw in the last video. www.youtube.com
Also, you can be a bit innovative and use the Trend lines to create alerts not just for the price but time as well.

How to use Trading View - Part 1 - Trend Lines and Time FramesHow to use Trading View - Part 1 - Trend Lines and Time Frames
Use these different tools to make the most of your trading View account.
Make sure to differentiate your time frames so that your charts are decluttered and you have a very clean chart handy always.
Avoid drawing too many lines and drawings at irrelevant time frames.
Keep it Simple,
Keep it Consistent,
Keep it Clean.

GRANULES : Dark days ahead?The daily chart for Granules India Ltd. signals a bearish outlook, particularly with the recent close at ₹532.40, a 5.29% drop. The price has approached a critical support level at ₹528. A breakdown below this level could trigger further downside toward ₹508, ₹486, and potentially ₹460. The 200-day moving average hovers around ₹567, and any close above ₹576 would invalidate this bearish view. However, until such a reversal occurs, the trend remains downward.
Adding to the negative sentiment, the recent earnings report highlights weak revenue performance, with the company posting ₹9.666 billion in revenue versus an estimated ₹10.588 billion, an 8.71% miss. While earnings per share marginally exceeded estimates, revenue underperformance suggests underlying business challenges. Overall, the chart's technicals and disappointing financials could drive further selling pressure on the stock.

GRANULES- Analysis - breakout? Bullish Levels -Day closing above 486 then 510 to 517 or 523 above this more bullish, then 547 to 553 or 560 then 584 to 590 or 596 then 620 to 626 or 633 then 657 to 664 or 670
Bearish Level - Day closing Below 474 then 413 to 407 then 368 below this more bearish
**Disclaimer -
I am not a SEBI registered analyst or advisor. I does not represent or endorse the accuracy or reliability of any information, conversation, or content. Stock trading is inherently risky and the users agree to assume complete and full responsibility for the outcomes of all trading decisions that they make, including but not limited to loss of capital. None of these communications should be construed as an offer to buy or sell securities, nor advice to do so. The users understands and acknowledges that there is a very high risk involved in trading securities. By using this information, the user agrees that use of this information is entirely at their own risk.
Thank you.

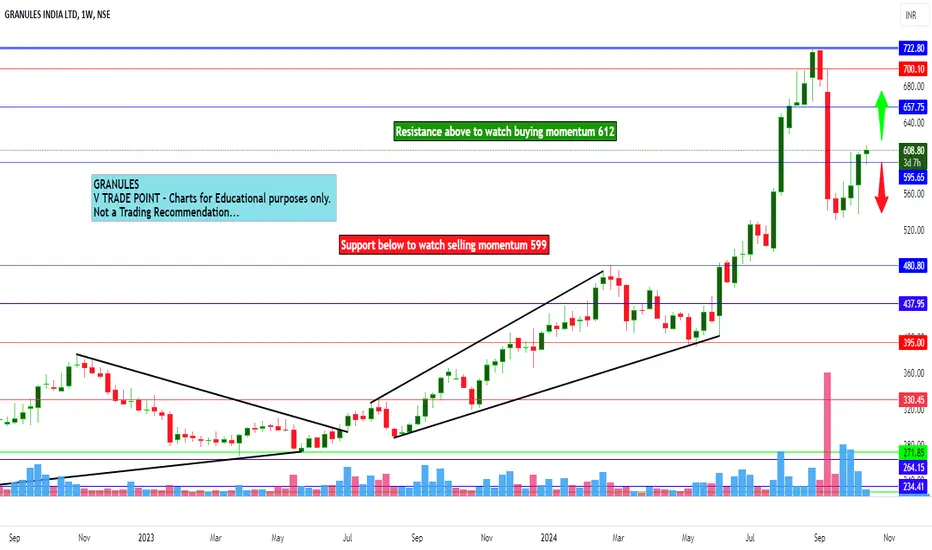
Granuels India Ltd view for Intraday 15th October #GRANULES Granuels India Ltd view for Intraday 15th October #GRANULES
Resistance 610. Watching above 612 for upside movement...
Support area 600. Below ignoring upside momentum for intraday
Support 600..Watching below 599 for downside movement...
Resistance area 610....
Above ignoring downside move for intraday
Charts for Educational purposes only.
Please follow strict stop loss and risk reward if you follow the level.
Thanks,
V Trade Point
GRANULES INDIA UPTREND BUY STOCK NAME - GRANULES INDIA
Trade Reason :
Weekly Strong Uptrend and Fib Correcction - 0.618 %
Trend Reversal Confirm .
Entry - 578 Rs
Target - 718 Rs
Stoploss - 527 Rs
Expected Return - 24.30 %
Happy Trading ...

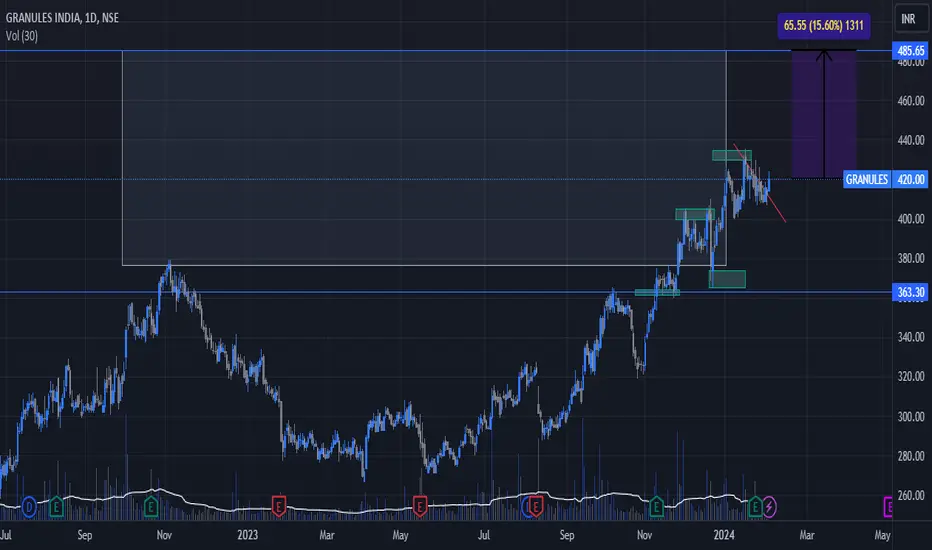
Granules Bullish !!This stock showing good bullishness
In the process of completing Cup pattern
Good stock
A 15 percent upside can be expected in near term
Good for swing!
Granules ready to long This stock gave B.O after consolidation
Typical Box / U consolidation, B.O and retest.
Good stock with decent financials
If the trend continues then targets can be acheived.

Some big boy has exited GranulesGranules feel over 16% today and the volume was also one of the highest - telltale sign that some big boy(s) has exited - time for us exit as well! Can also go short and use it to hedge your other longs

$granules india ltddropped to vwap from swing low
should see a reaction here
dip below it on open then reclaim
needs to see some strong engulfing candles else could be a dead cat till the
white line
no idea why this dippy happened
lets see what we get in the morn

GRANULES Towards 500?Granules form 483 for Telangana plant...This point is very bad....torn documents will not sit well. So a news driven rally if 594 breaks can make it go towards 500.

Granuels India Ltd view for Intraday 9th September #GRANULES Granuels India Ltd view for Intraday 9th September #GRANULES
Buying may witness above 693
Support area 682. Below ignoring buying momentum for intraday
Selling may witness below 682
Resistance area 693
Above ignoring selling momentum for intraday
Charts for Educational purposes only.
Please follow strict stop loss and risk reward if you follow the level.
Thanks,
V Trade Point

granules positional tradeGranules - A positional trade with RR approx 1:4,
Rising relative strength, inverse head and shoulder pattern with no resistance on left side as the cmp is high of more than 2 years and above fib retracement of 61.8%.
Breakout with good volume.
Volume decreasing during formation of base.

Granuels India Ltd view for Intraday and short term 29th AugustGranuels India Ltd view for Intraday and short term 29th August #GRANULES
Buying may witness above 711
Support area 700. Below ignoring buying momentum for intraday
Charts for Educational purposes only.
Please follow strict stop loss and risk reward if you follow the level.
Thanks,
V Trade Point

granules tringular break outabove 350
triangular break out showing on chart after longtime
good to buy an hold

GRANULE INDIA S/RSupport and Resistance Levels: In technical analysis, support and resistance levels are significant price levels where buying or selling interest tends to be strong. They are identified based on previous price levels where the price has shown a tendency to reverse or find support.
Support levels are represented by the green line and green shade, indicating areas where buying interest may emerge to prevent further price decline.
Resistance levels are represented by the red line and red shade, indicating areas where selling pressure may arise to prevent further price increases. Traders often consider these levels as potential buying or selling opportunities.
Breakouts: Breakouts occur when the price convincingly moves above a resistance level (red shade) or below a support level (green shade). A bullish breakout above resistance suggests the potential for further price increases, while a bearish breakout below support suggests the potential for further price declines. Traders pay attention to these breakout signals as they may indicate the start of a new trend or significant price movement.
20 EMA: The yellow line denotes 20 EMA, to interpret the 20 EMA, you need to compare it with the prevailing stock price. If the stock price is below the 20 EMA, it signals a possible downtrend. But if the stock price is above the 20 EMA, it signals a possible uptrend.
Disclosure: I am not SEBI registered. The information provided here is for learning purposes only and should not be interpreted as financial advice. It is important to consult with a qualified financial advisor before making any investment decisions. Tweets neither advice nor endorsement.

Granules India Bearish Granules India stock may see a decline tomorrow, after a big rally a bearish doji candle is forming at the upper level. This may probably turn into a reverse trend in the coming sessions
