Graphite India (1M TF) - Big Technical Base ►NSE:GRAPHITE
⚙️ Materials: Commodity Cycle Turnaround
(Green energy metals, China recovery)
Sector context: India’s rising graphite demand (e.g. electrode expansion for steel, battery material on horizon) aligns well with Graphite India’s positioning.
►Graphite India is the largest producer of graphite electrodes in the country and one of the largest in the world.
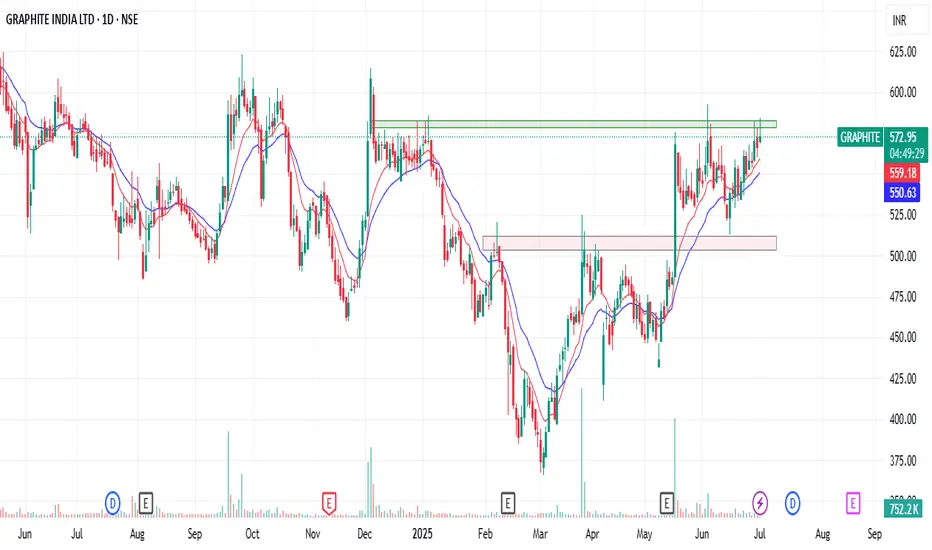
At the time of charting NSE:GRAPHITE PA was at 550
PA in 1D TF has bounced from Support
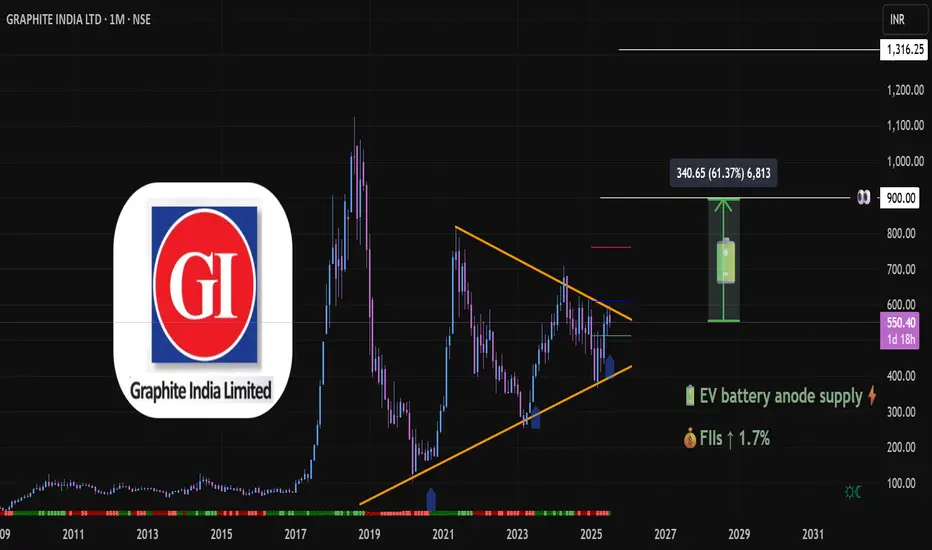
Trend 1M TF: Long-term Symmetrical 📐triangle formation since 2018 highs — price now testing upper trendline
Monthly shows range‑bound to mild consolidation since topping near ₹623 and bouncing around ₹540‑560.
Multi-year consolidation forming a textbook volatility squeeze, often a precursor to explosive directional moves. Volume compression inside the triangle suggests strong hands accumulating.
Candlestick structure: Bullish engulfing-type recovery candle forming off the trendline support. Breakout Energy above 586 = potential energy. A monthly close👀 above the downtrend line may unlock significant upside ⇗ momentum.
Daily MACD turning positive, weekly and monthly crossovers 🟢suggest building momentum.
Monthly Resistance line 762🔴 Pivot line 🔵611 Support🟢512
₹575–586 is the breakout threshold. Above the pivot and away ⇗
Post-break, next projection target : ₹900 (≈+60%), followed by ₹1,300. (Text Book)
📊 Fundamental Alignment
🔋 EV Battery Anode Narrative: Global lithium/graphite demand surging → Graphite India well-positioned as key electrode supplier.
🌍 China Supply Risks = India graphite players gain global relevance.
💼 FIIs Inflow: Recent uptick (+1.7%) hints at sectoral re-rating in anticipation of capex cycles and commodity upturn.
📉 Valuation Context: After steep de-rating post-2018, current price offers favorable risk-reward compared to earnings expectations and sector re-alignment.
► Graphite electrodes are the main heating element used in an electric arc furnace
extremely high levels of heat generated in EAF.
Graphite electrodes are divided into 4 Types: RP Graphite electrodes, HP Graphite electrodes, SHP Graphite electrodes, UHP Graphite electrodes.
► Needle coke👀 is a key ingredient in the production of graphite electrodes for electric arc furnaces (EAFs) in the steel industry.
🧰 Strategic Outlook
►we'll follow this trade closely and within incoming week we'll up a close up view of 4h TF
Bias: Strongly Bullish on breakout; Neutral if it stalls below ₹550.
Targets: ₹900 (swing), ₹1,300 (positional)
ideal for swing/long-term portfolio adds
Alternate Case: Breakdown below🔻₹480 negates pattern; re-evaluate around ₹400 for demand re-entry.
Always DYOR
See you on the other side
💡 Reflective Close:
“What if true breakouts don’t come from hype — but from time, patience, and the quiet work of smart money preparing long before headlines catch up? Are you watching the price, or are you watching the behavior behind the price?”
GRAPHITE trade ideas
GRAPHITE NEAR TO BOGRAPHITE is about to break out, as it is moving in a tight range and volume has almost diminished, it shows no sellers left, can give good numbers in coming weeks.

GRAPHITE - BREAKOUT NSE:GRAPHITE Breakout stock with consolidation of many years, weekly and monthly also positive.

Resistance @575. BIg move above 584Keep on radar need to close above 584 for big move. Will test patience

Graphite IndiaFresh View
Graphite CMP 571.85
SL 550
Looks good for a quick 5-10% gains
Swing/Positional

Graphite Ready To Flyy!!!Buy GRAPHITE at 524 and all dips...
Target1 - 765
Target2 - 908 (if closing above 908)
Target3 - 1030
Disclaimer :-
I am not SEBI registered. The information provided here is for education purposes only.
I will not be responsible for any of your profit/loss with this channel suggestions.
Consult your financial advisor before taking any decisions

Graphite India LongTook entry today
Entry: 594.05
SL: 581
Target 1: 608
Target 2: 623
Entered near MAs, MAs crossover
Making higher lows inside the base
Stock is in stage 2
Took entry because IB broke and IBs were near MAs

GRAPHITE INDIA - BUYNSE:GRAPHITE Weekly chart showing positive momentum after three weeks consolidation. macd showing positive momentum. Short term averages are near to price to ready for breakout.

GRAPHITESupport and Resistance Levels: In technical analysis, support and resistance levels are significant price levels where buying or selling interest tends to be strong. They are identified based on previous price levels where the price has shown a tendency to reverse or find support.

Trade Plan 23Graphite India Ltd is mainly engaged in the business of manufacturing and selling of graphite & carbon and other products.
The company is adding a 10 MW capacity to its hydel power plant and an 18.9 MW wind power plant at Nandurbar, Maharashtra. As of Q1 FY25, it has partially installed wind power plants with an installed capacity of 14.7 MW. It incurred a capex of Rs. 258 Cr in FY24.

graphite india looks good for 630++
Cmp 600
stop 580
target 630
risk 20reward 30
period 2 weeks
short positional call
keep strict stoploss
broke resistance level with volume
expect steel millers to expand operation to cope with rising demand.
(Tata steel alsready made largest furnace)
As they expand, they will require electrodes in their furnace..
HEG AND Graphite india arr the major graphite rod makers

GRAPHITE INDIA LTD S/RSupport and Resistance Levels:
Support Levels: These are price points (green line/shade) where a downward trend may be halted due to a concentration of buying interest. Imagine them as a safety net where buyers step in, preventing further decline.
Resistance Levels: Conversely, resistance levels (red line/shade) are where upward trends might stall due to increased selling interest. They act like a ceiling where sellers come in to push prices down.
Breakouts:
Bullish Breakout: When the price moves above resistance, it often indicates strong buying interest and the potential for a continued uptrend. Traders may view this as a signal to buy or hold.
Bearish Breakout: When the price falls below support, it can signal strong selling interest and the potential for a continued downtrend. Traders might see this as a cue to sell or avoid buying.
20 EMA (Exponential Moving Average):
Above 20 EMA: If the stock price is above the 20 EMA, it suggests a potential uptrend or bullish momentum.
Below 20 EMA: If the stock price is below the 20 EMA, it indicates a potential downtrend or bearish momentum.
Trendline: A trendline is a straight line drawn on a chart to represent the general direction of a data point set.
Uptrend Line: Drawn by connecting the lows in an upward trend. Indicates that the price is moving higher over time. Acts as a support level, where prices tend to bounce upward.
Downtrend Line: Drawn by connecting the highs in a downward trend. Indicates that the price is moving lower over time. It acts as a resistance level, where prices tend to drop.
RSI: RSI readings greater than the 70 level are overbought territory, and RSI readings lower than the 30 level are considered oversold territory.
Combining RSI with Support and Resistance:
Support Level: This is a price level where a stock tends to find buying interest, preventing it from falling further. If RSI is showing an oversold condition (below 30) and the price is near or at a strong support level, it could be a good buy signal.
Resistance Level: This is a price level where a stock tends to find selling interest, preventing it from rising further. If RSI is showing an overbought condition (above 70) and the price is near or at a strong resistance level, it could be a signal to sell or short the asset.
Disclaimer:
I am not a SEBI registered. The information provided here is for learning purposes only and should not be interpreted as financial advice. Consider the broader market context and consult with a qualified financial advisor before making investment decisions.

Graphite monthly setupGraphite looks good after breakout, it's retesting and making a strong monthly candle.
Within few months it should breakout horizontally as well.

Graphite India - Medium TermWave 5 about to commence. Falling wedge should give a breakout.
Disclaimer: I have long positions in this stock.

Graphite is on the verge of breakoutGraphite can rise from here with in few years. Sl below the trend line.
Chart is self explanatory. Please follow the price action & take the trade as per your appetite.
The information provided here is only for educational purpose. The information provided here is not intended to be any kind of financial advice, investment advice, and trading advice. Investment in stock market is very risky and trading stocks, options and other securities involve risk. The risk of loss in stock market can be substantial. Moreover, I am not a SEBI registered analyst, so before taking any decision or before investing in any Share consult your financial advisor and also do your analysis and research.
Request your support and engagement by liking and commenting & follow to provide encouragement.

GRAPHITE
Disclaimer:
Kind regards to all friends and members ,
Stock market investment is subject to 100% market risks. Our company is not a SEBI registered company. Please consult your financial advisor before investing. This is for learning and training purposes only. Market Traps administrators are not responsible for any financial gains or losses resulting from your decisions. You acknowledge that stock market investments are highly risky and that you understand the market risks involved. Hence any legal action is void.

CHART PATTERN INVERTED HEAD AND SHOULDER - GRAPHITE INDIAGraphite India is forming inverted head and shoulder pattern, that is considered as bullish chart pattern formation.
This chart is only for educational purpose do your own study before taking any trades

Just A View - GRAPHITE📊 Script: GRAPHITE
📊 Sector: Capital Goods-Non Electrical Equipment
📊 Industry: Electrodes - Graphites
Key highlights: 💡⚡
📈 Script is trading near at Neckline of Double Dottom on Monthly Chart.
📈 One can go for Risky Swing Trade for 66 points till resistance which is 755.
📈 Safe trader can buy only above 755.
BUY ONLY ABOVE 755
⏱️ C.M.P 📑💰- 688
🟢 Target 🎯🏆 - 939
⚠️ Important: Always maintain your Risk & Reward Ratio.
✅Like and follow to never miss a new idea!✅
Disclaimer: I am not SEBI Registered Advisor. My posts are purely for training and educational purposes.
Eat🍜 Sleep😴 TradingView📈 Repeat 🔁
Happy learning with trading. Cheers!🥂


GRAPHITE INDIA MONTHLY TIME FRAME - MY VIEWThe Structure looks good to us, waiting for this instrument to correct and then give us these opportunities as shown on this instrument (Price Chart).
Note: Its my view only and its for educational purpose only. Only who has got knowledge about this strategy, will understand what to be done on this setup. its purely based on my technical analysis only (strategies). we don't focus on the short term moves, we look for only for Bullish or Bearish Impulsive moves on the setups after a good price action is formed as per the strategy. we never get into corrective moves. because it will test our patience and also it will be a bullish or a bearish trap. and try trade the big moves.
we do not get into bullish or bearish traps. We anticipate and get into only big bullish or bearish moves (Impulsive Moves). Just ride the Bullish or Bearish Impulsive Move. Learn & Know the Complete Market Cycle.
Buy Low and Sell High Concept. Buy at Cheaper Price and Sell at Expensive Price.
Keep it simple, keep it Unique.
please keep your comments useful & respectful.
Thanks for your support.....
Tradelikemee Academy
Sanjay K G

GRAPHITE INDIA Very Bullish Catch on WeeklyHello Traders,
GRAPHITE INDIA back to Track on Weekly Chart after Triangle Breakout. It is extremly ready to take off from 600 to 715 and 940 Levels.
Go with Stop loss 520.
education purpose only--
Plan according as per your Risk Management.
Play safe. All the Best.

