Graphite India Graphite india Long term chart showing cup pattern in making it can go to 2,000 levels in long term(3 to 5 Years)
Advantages
Commodity cycle
Steel Price Soaring up
GRAPHITE trade ideas

flag breakoutprice has formed flag and broke with volume, seen weak sellers in few last sessions. breaking with wide spread, price is above 200 MA, with last swing low as sl (positional)

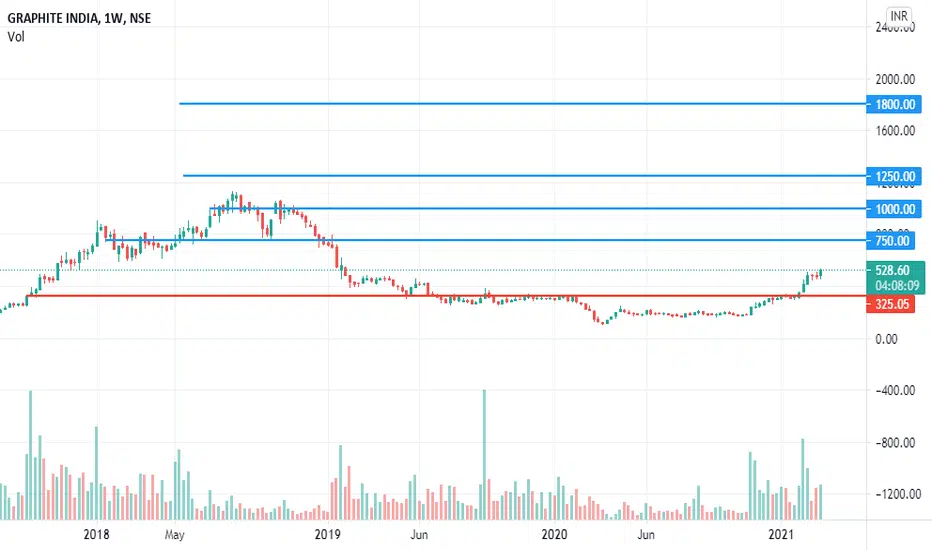
Graphite India weekly Weekly chart of Graphite India today resistance faced near 594 if this resistance cleared or Breakout happens then it could move towards 800

GRAPHITE INDIA Graphite India today touches its resistance at 594 levels it may consolidate here if Breakout comes then eyes will be for next traget 780

Long position for GRAPHITE INDIAThe price has broken the barrier and closed above the parallel zone on a 1-D chart.
MACD is about to close the gap and move in the positive zone. RSI is upwards.
So expecting an upwards trend in the coming week if the market stays positive.

GRAPHITE LONG INTRADAY 12 MAR,2021Dear trader,
If u look at the chart of GRAPHITE (analysis based intraday only) the GRAPHITE support 1 at 512 and Target at 525 and Stop loss at 500.
The chart clearly indicates Bullish Trend you can also see the candle stick patters for more indepth analysis.
In Intraday most important thing is to enter and exit points.
Our signals are based on analytics, algorithms, mathematical derivatives.
Always be a responsible trader, kindly trade only when you have maximum opportunity in the market with minimum risk and with keynotes like data, analysis and proper strategies.
Kindly message us for strategies and analysis.


Graphite Breakout Today Graphite gave breakout on daily time frame
Graphite is rising with strong demand candles there is hardly any supply candle visible on chart, volume is also expanding with price this is sign of strong hands buying in momentum
one can long graphite here or wait for pullback till 508-500 sl is at 438


Graphite - Pick Me upGraphite - It is now in that polarity zone. More likely to cross the line on the other side towards 600+. SL is below 420. Let us see.
DISC: Not a SEBI Registered. I post charts for my own study.


GRAPHITE SWING IDEA!GRAPHITE AFTER A 3 YEAR CRASH, SHOWS SIGNS OF REVERSAL AND RECENTLY CLOSED ABOVE A STRONG MONTHLY SUPPORT.
WE MAY CONSIDER AN ENTRY BETWEEN 270-280 LEVELS FOR A SWING TRADE.
TARGETS ARE IN CHART...
NOTE: NIFTY @ ALL TIME HIGH AND ENTRY AT THIS TIME IS ONLY FOR STRONG HEARTS!

Graphite India - Range Breakout with VolumeGraphite India - Range Breakout with Volume
SL - 215
T1 - 288
T2 - 329
T3 - 392


Graphite India brearish expecting 177 and 165 soonGraphite India brearish expecting 177 and 165 soon . Refer image for reasons , unless market moves upward moves or is news driven . Share your ideas and correct me if I am wrong

#GRAPHITE #BANKNIFTY #NIFTY #NSE #BSE #TRADING #COVID19 #INVEST#GRAPHITE
GRAPHITE INDIA LTD.
CMP: 188
Target 1: 245
Target 2: 320
SL: 175
Take it before takes off


Graphite india - Good breakout with volumeGraphite India
Good break out with Volume today.
Points
19th August trend line closure above. with green candle.
Next 3 days retraced to trend line.
Today (25th Aug) took support at trend line and Zoom.
Also crossed 100 date price @ 202
target around 220
An one more. Volume fell last 2 days along with price indication no sellers.

Graphite Daily/hourly short 209-221 Graphite Daily/hourly short 209-221
pro:
1. 2 leg out in location time frame
2. Origin of Weekly supply zone
con:
1. intermediate 1 hr zone has few dosi candles of left. Bulls and bears fought nicely from
origin and then dropped.
2.15 min not at all good structure candles.
confirmation entry only
