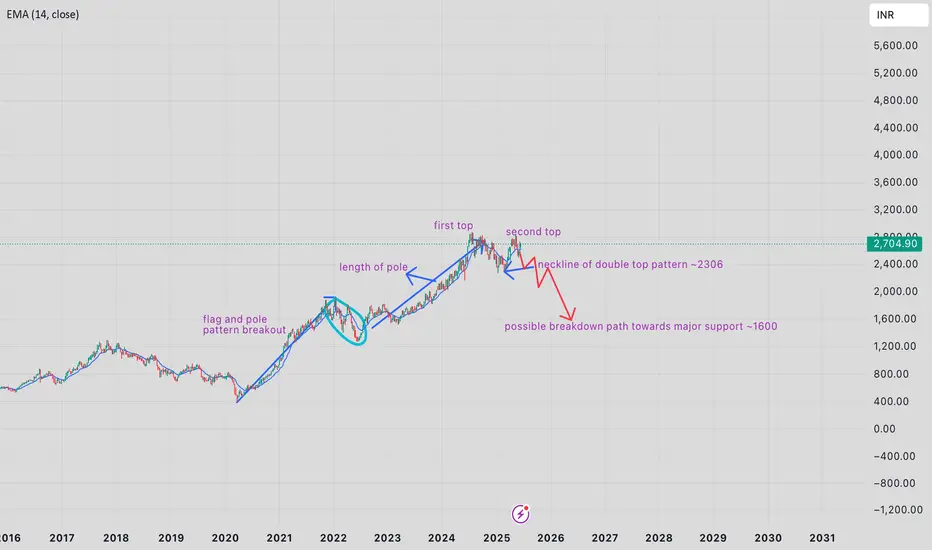
Possible breakdown of GRASIM-EQ GRASIM-EQ has reached its 100% fib lvls and there is a high chance that price will not be able to cross its recent ATH of ~2875 lvls.
which leads us to the current formation of double top pattern on weekly basis as shown in the pic. the neckline of double top pattern stands near ~2300 lvl which when broken will trigger intense selling.
as always people are advised to trade as per their risk capacity.
GRASIM trade ideas
Grasmi InDustries - Long Set-UPNSE:GRASIM
𝐆𝐫𝐚𝐬𝐢𝐦 𝐈𝐧𝐝𝐮𝐬𝐭𝐫𝐢𝐞𝐬
𝐄𝐧𝐭𝐫𝐘 Between 2530 -- 2600 (Weekly FVG)
𝐒𝐋 Below 2460 ( Swing Low
𝐓𝐚𝐫𝐠𝐞𝐭 - 2750 , 2800++

GRASIMNSE:GRASIM
Note :
1. One should go long with a Stop Loss, below the Trendline or the Previous Swing Low.
2. Risk :Reward ratio should be minimum 1:2.
3. Plan your trade as per the Money Management and Risk Appetite.
Disclaimer :
>You are responsible for your profits and loss.
>The idea shared here is purely for Educational purpose.
>Follow back, for more ideas and their notifications on your email.
>Support and Like incase the idea works for you.

#GRASIM INDUSTRIES (Supply Zone)Identify critical supply zones for GRASIM INDUSTRIES using advanced technical analysis. These zones highlight potential resistance areas where price reversals or pullbacks may occur, offering strategic opportunities for traders. Ideal for swing traders, breakout traders, and those focusing on risk management.

#GRASIM INDUSTRIES SUPPLY ZONEGrasim Industries, commonly known as Grasim, is a flagship company of the Aditya Birla Group. It is a leading player in the viscose staple fiber (VSF) and cement sectors, among other businesses. Grasim Industries operates in various supply zones depending on the product and market demand.

H&S breakdown in GRASIMNSE:GRASIM hourly chart shows head and shoulder breakdown in hourly chart. Most H&S breakdowns are followed by retest so chances are there would be an attempt to reclaim the neckline resistance.

Review and plan for 11th February 2025 Nifty future and banknifty future analysis and intraday plan.
Result analysis.
This video is for information/education purpose only. you are 100% responsible for any actions you take by reading/viewing this post.
please consult your financial advisor before taking any action.
----Vinaykumar hiremath, CMT

Grasim - Quick 10% move Grasim expected to get rejected from the levels of 2370.
This short term move has produce 9 to 10%.


grasimgrasim
Breakout of rounding bottom pattern
support near 2580 for intraday
RSI>60
Short term target is 2800++
crossover of 10/20/50 days

GRASIM - Educational purposeGRASIM - Trade analysis,
Price moving upside by making Higher Highs and Higher lows, over all trend is positive and in the near recent days in daily time frame made triangle pattern. over all expected price will move upside.

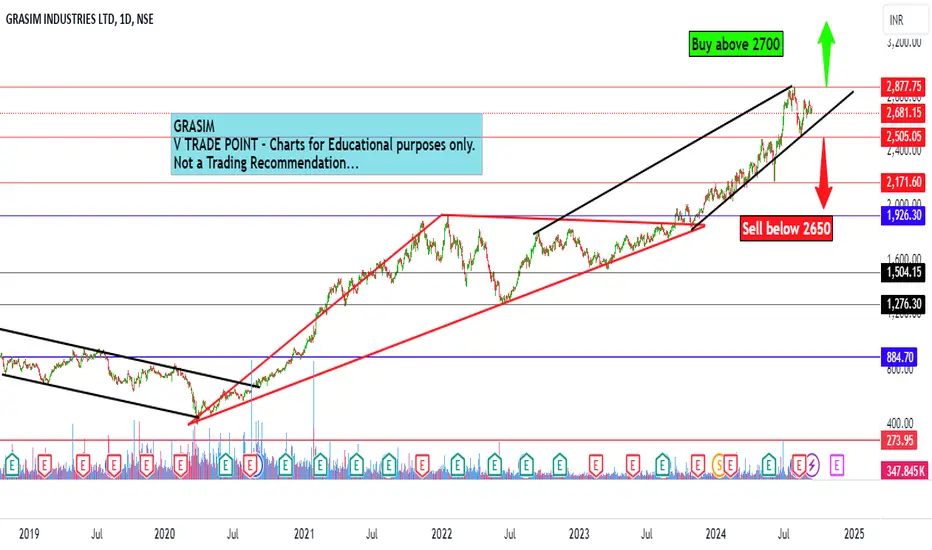
Grasim Industries Ltd view for Intraday 12th September #GRASIM Grasim Industries Ltd view for Intraday 12th September #GRASIM
Buying may witness above 2700
Support area 2650. Below ignoring buying momentum for intraday
Selling may witness below 2650
Resistance area 2700
Above ignoring selling momentum for intraday
Charts for Educational purposes only.
Please follow strict stop loss and risk reward if you follow the level.
Thanks,
V Trade Point
GRASIM: Awaiting Bullish Breakout with Key Resistance Levels
Bullish breakout expected above ₹2,781.25
Upside target: ₹2,866.55

Grasim - Swing TradeBullish Engulfing candle at demand zone, One can enter once high of todays candle is broken in coming week with SL below candle. And can look for target of 1:3 RR. This is not futures recommendation, please trade in cash market and stay with wind peace.
Please take advice from your advisor before taking any trade.

Grasim Weekly TF Breakout First Resistance -- 2709.6
Second Resistance --- 2734.3
Third Resistance --- 2776.5
First Support --- 2642.7
Second Support --- 2600.5
Third Support --- 2575.8
Positional long
Daily Avg. Delivery Volume %
21 Aug, 2024
68.0%
Week
56.5%
Month
59.0%

buy at zone - swing / intradayENTRY
- lines marked below is potential reversal zone ( PRZ)
- entry is strictly inside the zone
- look for buying confirmation in smaller time frame ( 15 minutes preferred )
EXIT
1. target
- mark fib retracement from C to latest swing low
- TGT 1 - 0.236 fib level ( intraday tgt)
- TGT 2 - 0.382 fib level
- TGT 3 - 0.5 fib level ( preferred target )
2. SL
- candle close below (PRZ)
- if u didn't get confirmation inside the zone , ignore this pick
- if candle close is below zone , this pattern becomes invalid . IGNORE THIS PICK
- RE-ENTRY can be done , if u again get buying confirmation inside the zone

Review and plan for 12th August 2024Nifty future and banknifty future analysis and intraday plan in kannada.
stocks to watch- included.
This video is for information/education purpose only. you are 100% responsible for any actions you take by reading/viewing this post.
please consult your financial advisor before taking any action.
----Vinaykumar hiremath, CMT

Grasim Industries Ltd
Targets and Stoploss mentioned in chart
Market Cap
₹ 1,22,202 Cr.
Current Price
₹ 1,856
High / Low
₹ 1,865 / 1,527
Stock P/E
17.9
Book Value
₹ 1,196
Dividend Yield
0.54 %
ROCE
12.5 %
ROE
8.85 %
Face Value
₹ 2.00
Promoter holding
42.8 %
EPS last year
₹ 104
EPS latest quarter
₹ 20.8
Debt
₹ 1,03,027 Cr.
Pledged percentage
0.00 %
Net CF
₹ 71.9 Cr.
Price to Cash Flow
-9.63
Free Cash Flow
₹ -24,610 Cr.
Debt to equity
1.31
OPM last year
18.4 %
OPM 5Year
20.2 %
Reserves
₹ 78,610 Cr.
Price to book value
1.55
Int Coverage
3.44
PEG Ratio
0.93
Price to Sales
1.04
Market Cap to Sales
1.04

GRASIM...... A TRAIGLE PATTERN BREAK OUTAs the picture shown it has given gud triangular pattern break out. it may have gud potential upside.

profit booking time in Grasim?
Grasim seems to have reached its current swing high. i think we should book profit and wait for retracements for reentry.

GRASIM INDUSTRIES S/R for 15/7/24Support and Resistance Levels: In technical analysis, support and resistance levels are significant price levels where buying or selling interest tends to be strong. They are identified based on previous price levels where the price has shown a tendency to reverse or find support.
Support levels are represented by the green line and green shade, indicating areas where buying interest may emerge to prevent further price decline.
Resistance levels are represented by the red line and red shade, indicating areas where selling pressure may arise to prevent further price increases. Traders often consider these levels as potential buying or selling opportunities.
Breakouts: Breakouts occur when the price convincingly moves above a resistance level (red shade) or below a support level (green shade). A bullish breakout above resistance suggests the potential for further price increases, while a bearish breakout below support suggests the potential for further price declines. Traders pay attention to these breakout signals as they may indicate the start of a new trend or significant price movement.
20 EMA: The yellow line denotes 20 EMA, to interpret the 20 EMA, you need to compare it with the prevailing stock price. If the stock price is below the 20 EMA, it signals a possible downtrend. But if the stock price is above the 20 EMA, it signals a possible uptrend.
Disclosure: I am not SEBI registered. The information provided here is for learning purposes only and should not be interpreted as financial advice. It is important to consult with a qualified financial advisor before making any investment decisions. Tweets neither advice nor endorsement.

SWING IDEA - GRASIM
Strong breakout on weekly TF
formed a flag and pole pattern which is a continuation pattern
a strong up move expected after a thorough consolidation
SL - 1856
TARGET - 2300 // 2320

Grasim Industries: Bullish Flag BreakoutGrasim Industries has formed a bullish flag pattern on the daily chart, signaling a strong continuation of the uptrend. The recent breakout is supported by high trading volume, which adds to the reliability of this pattern. Traders should watch for further upward movement as the bullish momentum continues. Proper risk management is advised, with attention to potential support levels below the breakout point. Stay tuned for updates as we monitor this promising setup.
