Greaves Cotton: Gearing Up for Upside Momentum! 🚀 Greaves Cotton: Gearing Up for Upside Momentum! 🚀
📉 CMP: ₹207.61
🔒 Stop Loss: ₹179
🎯 Targets: ₹253 | ₹290
Why It Looks Promising?
✅ Gap-Up Start: Week began with a gap-up and the stock is holding gains—sign of strength.
✅ 21 EMA Crossover: Today's move above the 21 EMA suggests bullish momentum building.
✅ Key Level Breach: ₹210 was the high on result day—sustaining above it confirms buyer interest and potential breakout.
💡 Strategy:
📈 Staggered entry can help manage risk in current volatility.
🔒 Keep SL at ₹179 to safeguard capital.
📍 Outlook: With signs of accumulation and breakout attempts, Greaves Cotton could see continued upside in the coming sessions.
📉 Disclaimer: Not SEBI-registered. Please do your own research or consult a financial advisor before investing.
#GreavesCotton #TechnicalBreakout #MomentumStock #SwingTrading #StockMarket
GREAVESCOT trade ideas

GRAVESCOT POSSIBLE UPRISEThe chart indicates a possible uptrend to cashon.
Upon clearly examining 1D time frame, you can see there's a huge support, once the price reaches there. We might examine some consolidation for a while and a possible uprise as indicated.
There's a good risk to reward in it.

GREAVESCOT NSE 2Y11M RBCUP BO WTF -SWING/POSITIONAL Stock Analysis
Trade Plan:
Entry: 50% of the total quantity at 260 DTF Close, with an additional 50% added at 294 DTF Close Price.
Stop Loss: 228
Target 1: 312
Target 2: 341, TGT3 : 395
Hold for a period of 9 months to 2 year or until the target 3 is reached.
Chart Pattern:
The stock has formed a Rounding Bottom Cup in a time of THREE Years, there has been a Steady Bullish Copybook rise for the past 6months with a considerable volume buying
Technical Indicators:
The stock’s daily timeframe (DTF) shows that the price is currently trading above the 50-day exponential moving average (EMA) and the 20-day EMA above the 50D EMA. This indicates an Ascending phase of alignment in the stock’s EMA. A bullish trend in formation on the DTF/WTF timeframe.
Additionally, the current price is near the 23.6% Fibonacci Extension level. This level could serve as a potential entry point for investors, depending on their risk tolerance. More cautious investors might consider entering above the 38.2% retracement level.
Volume Analysis:
There has been a consistent buying volumes for a Month now. There is buying in the past. weeks are above the 20VMA.
Prioritize Watch List:
Keep this stock in your watch list for further analysis and potential trading opportunities.
Disclaimer: This information is solely for educational and reference purposes. Trading inherently carries risks, and it’s crucial to exercise caution and conduct comprehensive research before making any investment decisions. Make sure you have a well-defined risk appetite, proper position sizing, and a stop-loss order based on your risk tolerance. Review your Portfolio periodically. Exit positions when the price closes 7-8% below your entry point or When 9EMA crosses Below 21EMA in DTF. Earlier too basis your Risk profile. Consider re-entering the market when the trend reverses.Before engaging in any trading activities, it is paramount to thoroughly comprehend these technical analysis concepts and conduct extensive research on the stocks you are interested in. Furthermore, consulting a certified financial advisor can offer valuable insights and guidance before making investment decisions.
Technical Analysis Concepts:
Multiple Time Frame Analysis (MTFA):
Daily Time Frame (DTF): Used for short-term analysis and identifying trends.
Weekly Time Frame (WTF): Provides a broader perspective and helps in trend confirmation.
Monthly Time Frame (MTF): Ideal for long-term analysis and trend analysis.
All-Time High (ATH): The highest price reached on a specific chart.
Lifetime High (LTH): The highest price reached over the entire chart’s history.
Stop Loss (SL): A predetermined price level at which an investment is automatically exited to limit potential losses.
Swing Trade: A trading strategy that involves holding positions for a significant period, typically few weeks to months.
Positional Trade: A trading strategy that aims to capitalize on long-term trends and position oneself accordingly.
CHART PATTERNS
Rounding Bottom Cup/Handle (RBC&H): A pattern that signals a potential reversal from a downtrend.
Breakout (BO): A price move closure above a resistance or below a support level.
Flag & Pole BO: (F&P BO) Bullish Continuation Pattern
Consolidation : Price Typically Swings between a Range for a period of Time Long or Short basis the MTFA. Breaking out of this range UPWARDS is an opportunity to BUY and DOWNWARDS is SELL opportunity.
Moving Averages:
Exponential Moving Average (EMA): A popular moving average that places more weight on recent price data.
Volume-Weighted Moving Average (VWMA): A moving average that gives more weight to high-volume stocks.
Fibonacci Retracement/Extension:
Trend-based Fibonacci Retracement: Used to identify potential support and resistance levels during re-tracements.
Trend-based Fibonacci Extension: Used to identify potential breakout levels during extensions.

GREAVESCOTGREAVESCOT
watch above levels. redline is our SL.
DISCLAIMER : I am NOT a SEBI registered advisor or a financial adviser. All the views are for educational purpose only.


Bullish view on Greaves cottonSwing trade idea 💡
Buy above 251
SL 220
Target 🎯 390
Disclaimer -We are not responsible for your profit and loss, it's only for education purpose analysis.manage your risk and trade own
Swastik capital

GREEVES COTTONGREEVES COTTON
MTF Analysis Price
GREEVES COTTONYearly Demand 95
GREEVES COTTON 6 Month Demand 93
GREEVES COTTONQtrly Demand BUFL 148
GREEVES COTTONMonthly Demand 200
GREEVES COTTONWeekly Demand 179
GREEVES COTTONDaily Demand DMIP 169
ENTRY -1 Long 179
SL 155
RISK 24
REWARD 101
Target as per Entry-1 280
RR 4
Last High 319
Last Low 154
ENTRY -2 Long 169
SL 155
RISK 14
REWARD 111
Target as per Entry-2 280
RR 8
Last High 319
Last Low 154
Trade Set Up
Buy Volume -1 As per Entry-1 2,000
Buy Volume -2 As per Entry-2 2,000
Average Buy Price 174
Trade Value 696,000
SL Point 155
RISK 19
Exit Target 280
Target Value 1,120,000
Profit Target 424,000
RISK Value 76,000
Risk to Reward 6

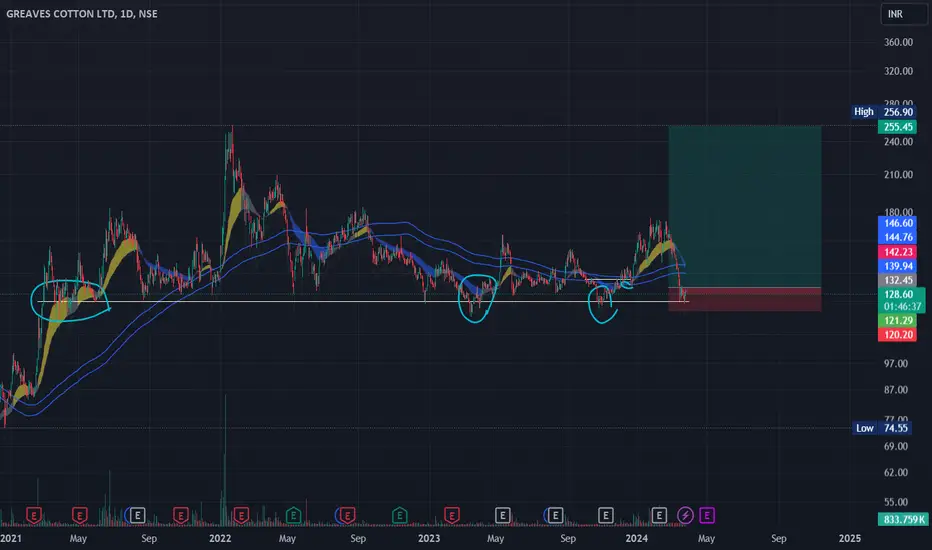
GREEVES COTTON LTD S/R Support and Resistance Levels:
Support Levels: These are price points (green line/shade) where a downward trend may be halted due to a concentration of buying interest. Imagine them as a safety net where buyers step in, preventing further decline.
Resistance Levels: Conversely, resistance levels (red line/shade) are where upward trends might stall due to increased selling interest. They act like a ceiling where sellers come in to push prices down.
Breakouts:
Bullish Breakout: When the price moves above resistance, it often indicates strong buying interest and the potential for a continued uptrend. Traders may view this as a signal to buy or hold.
Bearish Breakout: When the price falls below support, it can signal strong selling interest and the potential for a continued downtrend. Traders might see this as a cue to sell or avoid buying.
MA Ribbon (EMA 20, EMA 50, EMA 100, EMA 200) :
Above EMA: If the stock price is above the EMA, it suggests a potential uptrend or bullish momentum.
Below EMA: If the stock price is below the EMA, it indicates a potential downtrend or bearish momentum.
Trendline: A trendline is a straight line drawn on a chart to represent the general direction of a data point set.
Uptrend Line: Drawn by connecting the lows in an upward trend. Indicates that the price is moving higher over time. Acts as a support level, where prices tend to bounce upward.
Downtrend Line: Drawn by connecting the highs in a downward trend. Indicates that the price is moving lower over time. It acts as a resistance level, where prices tend to drop.
Disclaimer:
I am not a SEBI registered. The information provided here is for learning purposes only and should not be interpreted as financial advice. Consider the broader market context and consult with a qualified financial advisor before making investment decisions.

Amazing breakout on Weekly Timeframe - GREAVESCOTCheckout an amazing breakout happened in the stock in Weekly timeframe, macroscopically seen in Daily timeframe. Having a great favor that the stock might be bullish expecting a staggering returns of minimum 25% TGT. IMPORTANT BREAKOUT LEVELS ARE ALWAYS RESPECTED!
NOTE for learners: Place the breakout levels as per the chart shared and track it yourself to get amazed!!
#No complicated chart patterns
#No big big indicators
#No Excel sheet or number magics
TRADE IDEA: WAIT FOR THE STOCK TO BREAKOUT IN LOWER TIMEFRAME AND RETRACE IF NEEDED. SL IS NEARER SUPPORT ZONE IN Daily TIMEFRAME.
Checkout an amazing breakout happened in the stock in Weekly timeframe.
Breakouts happening in longer timeframe is way more powerful than the breakouts seen in Daily timeframe. You can blindly invest once the weekly candle closes above the breakout line and stay invested forever. Also these stocks breakouts are lifelong predictions, it means technically these breakouts happen giving more returns in the longer runs. Hence, even when the scrip makes a loss of 10% / 20% / 30% / 50%, the stock will regain and turn around. Once they again enter the same breakout level, they will flyyyyyyyyyyyy like a ROCKET if held in the portfolio in the longer run.
Time makes money, GREEDY & EGO will not make money.
Also, magically these breakouts tend to prove that the companies turn around and fundamentally becoming strong. Also the magic happens when more diversification is done in various sectors under various scripts with equal money invested in each N500 scripts.
The real deal is when to purchase and where to purchase the stock. That is where Breakout study comes into play.
LET'S PUMP IN SOME MONEY AND REVOLUTIONIZE THE NATION'S ECONOMY!

Darvas Box Strategy - Break out Stock - Swing TradeDisclaimer: I am Not SEBI Registered adviser, please take advise from your financial adviser before investing in any stocks. Idea here shared is for education purpose only.
Stock has given break out. Buy above high. Keep this stock in watch list.
Buy above the High and do not forget to keep stop loss, best suitable for swing trading.
Target and Stop loss Shown on Chart. Risk to Reward Ratio/ Target Ratio 1:2
Stop loss can be Trail when it make new box / Swing.
Be Discipline, because discipline is the key to Success in Stock Market.
Trade what you See Not what you Think.

Greaves Cotton on the Rise: Bullish Breakout/Profit-Taking AheadKey Observations:
Price Zones:
The chart marks distinct price zones: 75-50, 50-25, and 25-0 (suggesting progressive support and resistance levels).
Each zone shows a corresponding price increase with increasing volumes.
Trend Analysis:
Uptrend Continuation: The green candlestick dominance and price consolidation in each box imply a steady accumulation phase before breakout.
Volume Correlation: The volume surges during price breakouts, validating strong buying interest.
A projected price target of ₹319.15 suggests a bullish outlook.
Exponential Moving Average (EMA):
The stock price remains consistently above the EMA lines (green and red curves), signaling a bullish momentum.
The convergence and divergence between the EMA lines act as entry and exit signals.
Volume Data:
Significant increases in trading volume align with each breakout.
The highest volume surge is seen in the 75-50 to 50-25 transition, indicating institutional buying.
Recommendations:
For Long-Term Investors:
Hold or add more on dips near ₹260-₹270, as the stock shows signs of a robust breakout.
Consider trailing stop-loss around ₹240 to safeguard gains while retaining upside potential.
For Swing Traders:
Watch for any retracement near ₹275 to enter positions targeting ₹319+.
A break below ₹250 could trigger short-term bearish sentiment—manage risks accordingly.
For Intraday Traders:
High-volume zones near ₹280 and above could serve as scalping opportunities.
Trade cautiously near resistance levels ₹300-₹319.
Probability Assessment:
Bullish Scenario:
70% probability of price hitting the ₹319.15 target within the short term (if supported by high volume and broader market sentiment).
Bearish Scenario:
30% probability of pullback toward ₹240 in case of profit booking or weak broader market cues.
Disclaimer: This is intended solely for study and analysis purposes and should not be considered as investment advice.

GREAVESCOTNSE:GREAVESCOT
Note :
1. One should go long with a Stop Loss, below the Trendline or the Previous Swing Low.
2. Risk :Reward ratio should be minimum 1:2.
3. Plan your trade as per the Money Mangement and Risk Appetite.
Disclamier : You are responsible for your profits and loss.
The idea shared here is purely for Educational purpose.
Follow back, for more ideas and their notifications on your email.
Support and Like incase the idea works for you.

greaves cottonEnergy solutions provider's EV unit Greaves Electric Mobility plans to raise 10 bln rupees ($117 mln) via IPO, according to draft papers filed by it

Greaves Cotton - Positional Trade IdeaGreaves Cotton - Positional Trade Idea 🚀
📈 Multi-Year Breakout
Greaves Cotton has broken out of a long-term consolidation range on the weekly chart with a surge in volume, indicating strong bullish sentiment.
Entry: ₹260+
Target 1: ₹300
Target 2: ₹340
Stop-loss: ₹230
RSI at 71 reflects bullish momentum; watch for sustained volume to confirm the trend.
#GreavesCotton #BreakoutTrade #PositionalTrade #BSE

A short term technical tradePrice broken almost 2.5 yrs consolidation with significant volumes.. ..
Buying zone 179-186 if comes....TGT 235 ...sl below 175 closing basis..only for educational purpose and not any recommendation...
I am not a sebi registered Research analyst....

Graves cotton Will start for UpsideGraves cotton Will start for Upside possible target 208-240 Invalid 158 Now 185.77

Darvas Box Strategy-Breakout Stockisclaimer: I am Not SEBI Registered adviser, please take advise from your financial adviser before investing in any stocks. Idea here shared is for education purpose only.
Stock has given break out. Buy above high. Keep this stock in watch list.
Buy above the High and do not forget to keep stop loss, best suitable for swing trading.
Target and Stop loss Shown on Chart. Risk to Reward Ratio/ Target Ratio 1:1 & 1:2.
Stop loss can be Trail when it make new box.
Be Discipline, because discipline is the key to Success in Stock Market.
Trade what you See Not what you Think.

Greaves Cotton 2 Year box breakout PREMPTING🚀 Greaves Cotton: 2-Year Box Breakout Preempting! 🚀
Current Market Price: 179
Stop Loss: 148
Target: 240
Greaves Cotton is gearing up for a potential 2-year box breakout, with technical indicators pointing to a significant opportunity. Keep a close watch as it approaches key levels.
📉 Risk Management: Protect your position with a stop loss at 148.
📊 Disclaimer: As a non-SEBI registered analyst, I recommend conducting thorough research or seeking advice from financial professionals before making investment decisions. Exciting times ahead!
#MarketAnalysis #GreavesCotton #TechnicalAnalysis #BoxBreakout #InvestmentOpportunities

GREAVESCOT LONGGREAVESCOT is the growth stock but its in IT sector we found Rs.800 is a under value Rs.1700 is a over value based on up-to this year company result....
so this value(under and over value) will change year to year
but now this stock will reach RS.800+(under value) like a growth stock after that it will act like a value stock up-to Rs.1700+(over value)
long-term doesn't want perfect entry
my entry was 163
company wont go ZERO
ITS A INVESTING PURPOSES>>SEPUCLATION IS RISK... WE ARE NOT RESPONSIBLE FOR YOUR SEPUCLATION PROFIT AND LOSS>>>BUT WE ARE RESPONSIBLE FOR YOUR INVESTING PROFIT AND LOSS

SIP mode buy - GreavescottonPrice action based + Fundamental buy call ( NSE:GREAVESCOT )
**Education purpose
The stock price was under pressure for a long time, at the same time it maintained the lower range (Weekly closing chart). Parallely company was doing bad fundamentally.
Recently company has shown accumulation pattern on EMAs, Buying candles values, Rounding resistance smoothening. At the same time management has announced for margin expansion in upcoming quarter.
Strategy - Accumulate on every breakout (Or can wait for dip, but may missout on opportunity)

GREAVESCOTTON....No greaving with this Buy....Gave a good triangle breakout....tgt calculated accordingly..triangle moves are usually swift...Buy from investment point of view..

Greaves cotton testing channel bottomA smallcap company which is trying to retest the bottom with a higher high.
can be bought with a small SL of 6-7%
IMPORTANT LEVELS FOR THE DECADE 2020-2030Hey Folks !
In this Idea I am going to share you all a stock which is now available at a great discount.
Before moving to further discussion let me quickly share the only 3 Buying points which have potential and are a good buying point to accumulate the stock. First is the Current Market Price which is 123 , Second is 113 and the Third is 95.
If the stock goes below Rs95 then consider that you are getting the stock at a massive discount.
I dont know when this stock is going to move up but these levels wont let you down if you are a long term invester.
I have added only few levels to the Upside for now but later i will republish and update the Idea.
Now How these levels work?
On the chart you will see two coloured channels Red and Green.
I consider lower level of the green channel as a value buying area and Middle level as a normal buying area.
Target for these buying area are the Upper levels of the Green channel.
Generally i provide Stoploss to but For few stocks i dont prefer stoploss, Like in this stock all the 3 levels are the Good buying area for long term investment.
This analysis is made according to my Risk appetite ,i am not recommending any thing here , But i must say use these levels with you analysis to have an extra edge .
All the Best Folks !
For any Questions just drop a message.
