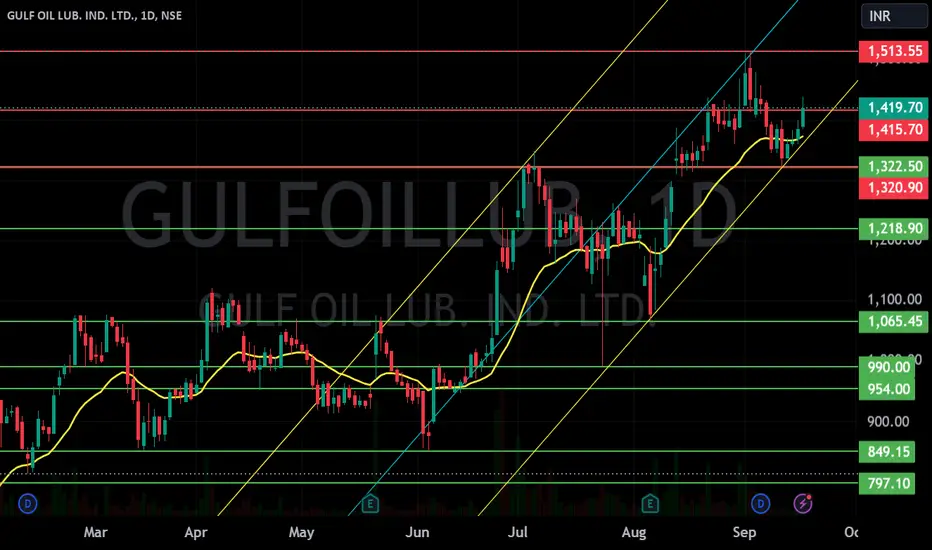
A multi-year breakout retestIt has retested a multi-year breakout zone and now seems to have broken above a small base pattern. On the Elliott Wave front - it has started Wave 3 up.
Next report date
—
Report period
—
EPS estimate
—
Revenue estimate
—
73.05 INR
3.60 B INR
36.31 B INR
15.81 M
About GULF OIL LUB. IND. LTD.
Sector
Industry
CEO
Ravi Shamlal Chawla
Website
Headquarters
Mumbai
Founded
1920
ISIN
INE635Q01029
FIGI
BBG006WX3Z25
Gulf Oil Lubricants India Ltd. engages in the manufacturing and distribution of lubricating products. The firm's products include automotive lubricants, industrial lubricants, EV fluids, marine lubricants, and AdBlue. The company was founded in 1920 and is headquartered in Mumbai, India.
Related stocks

GULFOILLUB SHARE A good description for a **GulfOilLub share** (presumably referring to shares of a company in the Gulf Oil Lubricants sector) would include details about the company’s business, its market position, financial performance, and outlook. Here’s an example of what a well-rounded description might look l

GULFOILLUBGULFOILLUB
daily timeframe
i just shared my experience it is not an invite or recommendation to trade.
if youn any doubt means Please leave comments for any query.
best wishes
DYSON

GULF OIL S/R Support and Resistance Levels:
Support Levels: These are price points (green line/shade) where a downward trend may be halted due to a concentration of buying interest. Imagine them as a safety net where buyers step in, preventing further decline.
Resistance Levels: Conversely, resistance levels (re
GULFOILLUB - Bullish oNStock name - Gulf Oil Lubes India Limited.
✅#GULFOILLUB
✅Next resistance 2128
✅Moved 106% in 38 weeks
Weekly chart
Chart is self explanatory everything.
Master score - B
Disclaimer : This is for demonstration and education purpose only. This is not buying and selling recommendation. I'm not SEBI r


Gulf Oil Lubricants India Ltd.*Gulf Oil Lubricants India Ltd*
RB Formation on Yearly Basis.
Strong Price BreakOut & Sustained.
Strong Vol Consolidation Continued & BuiltUp.
RSI: 1H>D>W<M. All in Bullish Zone.
EMAs: Widening Gaps amongst 20/ 50/ 100/ 200 levels on Weekly TF.
*Trail SL with Upside*
*Book Profit as per Risk Appe

GULFOILLUBE Buy active above ATH / CUPGULFOILLUBE Buy active @ 1,144.00 and presents an opportunity for a long trade with a promising risk-reward profile. The strategy involves entering a position at 4% above the ATH and employing a dynamic stop-loss approach to manage risk and maximize potential gains.
Buy active at GULFOILLUBE's ATH

Gulf Oil Lubricants India Limited is under breakout Gulf Oil Lubricants India Limited is under breakout . Consider buying only after getting a closing green candle above the trend line
Disclaimer: Education Purpose Only

GULFOILLUB looks good.GULFOILLUB looks good and made super setup.
This is only for educational purpose.

See all ideas
Summarizing what the indicators are suggesting.
Neutral
SellBuy
Strong sellStrong buy
Strong sellSellNeutralBuyStrong buy
Neutral
SellBuy
Strong sellStrong buy
Strong sellSellNeutralBuyStrong buy
Neutral
SellBuy
Strong sellStrong buy
Strong sellSellNeutralBuyStrong buy
An aggregate view of professional's ratings.
Neutral
SellBuy
Strong sellStrong buy
Strong sellSellNeutralBuyStrong buy
Neutral
SellBuy
Strong sellStrong buy
Strong sellSellNeutralBuyStrong buy
Neutral
SellBuy
Strong sellStrong buy
Strong sellSellNeutralBuyStrong buy
Displays a symbol's price movements over previous years to identify recurring trends.
Frequently Asked Questions
The current price of GULFOILLUB is 1,171.70 INR — it has decreased by −3.07% in the past 24 hours. Watch GULF OIL LUB. IND. LTD. stock price performance more closely on the chart.
Depending on the exchange, the stock ticker may vary. For instance, on NSE exchange GULF OIL LUB. IND. LTD. stocks are traded under the ticker GULFOILLUB.
GULFOILLUB stock has fallen by −5.16% compared to the previous week, the month change is a −6.79% fall, over the last year GULF OIL LUB. IND. LTD. has showed a −3.87% decrease.
We've gathered analysts' opinions on GULF OIL LUB. IND. LTD. future price: according to them, GULFOILLUB price has a max estimate of 1,800.00 INR and a min estimate of 1,490.00 INR. Watch GULFOILLUB chart and read a more detailed GULF OIL LUB. IND. LTD. stock forecast: see what analysts think of GULF OIL LUB. IND. LTD. and suggest that you do with its stocks.
GULFOILLUB reached its all-time high on Sep 3, 2024 with the price of 1,513.55 INR, and its all-time low was 230.00 INR and was reached on Jul 31, 2014. View more price dynamics on GULFOILLUB chart.
See other stocks reaching their highest and lowest prices.
See other stocks reaching their highest and lowest prices.
GULFOILLUB stock is 3.80% volatile and has beta coefficient of 1.02. Track GULF OIL LUB. IND. LTD. stock price on the chart and check out the list of the most volatile stocks — is GULF OIL LUB. IND. LTD. there?
Today GULF OIL LUB. IND. LTD. has the market capitalization of 57.78 B, it has increased by 0.80% over the last week.
Yes, you can track GULF OIL LUB. IND. LTD. financials in yearly and quarterly reports right on TradingView.
GULF OIL LUB. IND. LTD. is going to release the next earnings report on Aug 4, 2025. Keep track of upcoming events with our Earnings Calendar.
GULFOILLUB earnings for the last quarter are 18.60 INR per share, whereas the estimation was 20.00 INR resulting in a −7.00% surprise. The estimated earnings for the next quarter are 19.70 INR per share. See more details about GULF OIL LUB. IND. LTD. earnings.
GULF OIL LUB. IND. LTD. revenue for the last quarter amounts to 9.15 B INR, despite the estimated figure of 9.47 B INR. In the next quarter, revenue is expected to reach 9.31 B INR.
GULFOILLUB net income for the last quarter is 921.94 M INR, while the quarter before that showed 979.12 M INR of net income which accounts for −5.84% change. Track more GULF OIL LUB. IND. LTD. financial stats to get the full picture.
EBITDA measures a company's operating performance, its growth signifies an improvement in the efficiency of a company. GULF OIL LUB. IND. LTD. EBITDA is 4.72 B INR, and current EBITDA margin is 13.01%. See more stats in GULF OIL LUB. IND. LTD. financial statements.
Like other stocks, GULFOILLUB shares are traded on stock exchanges, e.g. Nasdaq, Nyse, Euronext, and the easiest way to buy them is through an online stock broker. To do this, you need to open an account and follow a broker's procedures, then start trading. You can trade GULF OIL LUB. IND. LTD. stock right from TradingView charts — choose your broker and connect to your account.
Investing in stocks requires a comprehensive research: you should carefully study all the available data, e.g. company's financials, related news, and its technical analysis. So GULF OIL LUB. IND. LTD. technincal analysis shows the sell today, and its 1 week rating is sell. Since market conditions are prone to changes, it's worth looking a bit further into the future — according to the 1 month rating GULF OIL LUB. IND. LTD. stock shows the buy signal. See more of GULF OIL LUB. IND. LTD. technicals for a more comprehensive analysis.
If you're still not sure, try looking for inspiration in our curated watchlists.
If you're still not sure, try looking for inspiration in our curated watchlists.