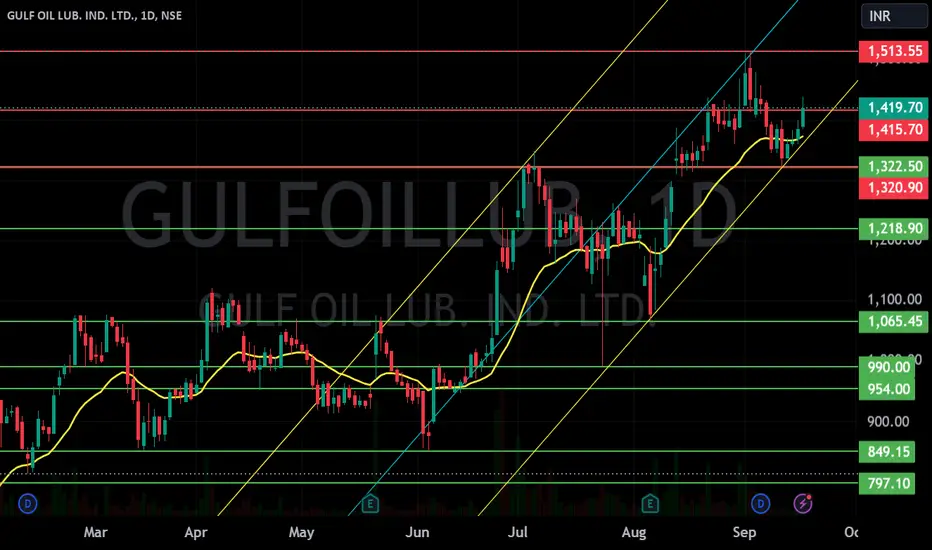
A multi-year breakout retestIt has retested a multi-year breakout zone and now seems to have broken above a small base pattern. On the Elliott Wave front - it has started Wave 3 up.
GULFOILLUB trade ideas

GULFOILLUB SHARE A good description for a **GulfOilLub share** (presumably referring to shares of a company in the Gulf Oil Lubricants sector) would include details about the company’s business, its market position, financial performance, and outlook. Here’s an example of what a well-rounded description might look like:
---
**GulfOilLub Share – Company Overview**
**GulfOilLub** is a leading player in the oil and lubricants industry, with a strong presence in the Gulf region and international markets. Specializing in high-performance lubricants, oils, and greases, the company serves a diverse range of industries including automotive, industrial, marine, and aviation. Known for its innovation and commitment to quality, GulfOilLub has built a robust reputation for providing reliable and environmentally-friendly products that meet the highest standards.
**Market Position**
With decades of experience in the sector, GulfOilLub holds a significant share of the regional lubricants market and has expanded its global footprint. The company is recognized for its comprehensive product range, superior customer service, and sustainability initiatives.
**Financial Performance**
GulfOilLub has demonstrated steady financial growth, driven by both regional demand and global expansion efforts. With strong revenue growth, improved profitability, and effective cost management strategies, GulfOilLub is poised to benefit from continued demand in both traditional and emerging markets.
**Investment Potential**
For investors, GulfOilLub offers an attractive proposition due to its consistent performance and the long-term growth potential of the lubricants and oil industry, particularly in the Middle East and Asia-Pacific regions. The company’s ongoing investments in research and development (R&D), as well as its strategic partnerships, position it well for future growth. Its strong cash flow, dividend history, and commitment to sustainability make it a reliable stock for long-term investors.
**Key Highlights:**
- Leading oil and lubricants manufacturer with a strong regional and international presence.
- Focus on innovation and sustainability in product offerings.
- Strong financial track record with consistent growth in revenue and profit.
- Positioned to capitalize on growth in the automotive and industrial sectors.
- Committed to long-term value creation for shareholders.
---
This description can be tailored further based on specific details about GulfOilLub, such as market data or recent news about the company. If you meant a different type of product or company, feel free to clarify!

GULFOILLUBGULFOILLUB
daily timeframe
i just shared my experience it is not an invite or recommendation to trade.
if youn any doubt means Please leave comments for any query.
best wishes
DYSON

GULF OIL S/R Support and Resistance Levels:
Support Levels: These are price points (green line/shade) where a downward trend may be halted due to a concentration of buying interest. Imagine them as a safety net where buyers step in, preventing further decline.
Resistance Levels: Conversely, resistance levels (red line/shade) are where upward trends might stall due to increased selling interest. They act like a ceiling where sellers come in to push prices down.
Breakouts:
Bullish Breakout: When the price moves above resistance, it often indicates strong buying interest and the potential for a continued uptrend. Traders may view this as a signal to buy or hold.
Bearish Breakout: When the price falls below support, it can signal strong selling interest and the potential for a continued downtrend. Traders might see this as a cue to sell or avoid buying.
20 EMA (Exponential Moving Average):
Above 20 EMA: If the stock price is above the 20 EMA, it suggests a potential uptrend or bullish momentum.
Below 20 EMA: If the stock price is below the 20 EMA, it indicates a potential downtrend or bearish momentum.
Trendline: A trendline is a straight line drawn on a chart to represent the general direction of a data point set.
Uptrend Line: Drawn by connecting the lows in an upward trend. Indicates that the price is moving higher over time. Acts as a support level, where prices tend to bounce upward.
Downtrend Line: Drawn by connecting the highs in a downward trend. Indicates that the price is moving lower over time. It acts as a resistance level, where prices tend to drop.
RSI: RSI readings greater than the 70 level are overbought territory, and RSI readings lower than the 30 level are considered oversold territory.
Combining RSI with Support and Resistance:
Support Level: This is a price level where a stock tends to find buying interest, preventing it from falling further. If RSI is showing an oversold condition (below 30) and the price is near or at a strong support level, it could be a good buy signal.
Resistance Level: This is a price level where a stock tends to find selling interest, preventing it from rising further. If RSI is showing an overbought condition (above 70) and the price is near or at a strong resistance level, it could be a signal to sell or short the asset.
Disclaimer:
I am not a SEBI registered. The information provided here is for learning purposes only and should not be interpreted as financial advice. Consider the broader market context and consult with a qualified financial advisor before making investment decisions.
GULFOILLUB - Bullish oNStock name - Gulf Oil Lubes India Limited.
✅#GULFOILLUB
✅Next resistance 2128
✅Moved 106% in 38 weeks
Weekly chart
Chart is self explanatory everything.
Master score - B
Disclaimer : This is for demonstration and education purpose only. This is not buying and selling recommendation. I'm not SEBI registered.


Gulf Oil Lubricants India Ltd.*Gulf Oil Lubricants India Ltd*
RB Formation on Yearly Basis.
Strong Price BreakOut & Sustained.
Strong Vol Consolidation Continued & BuiltUp.
RSI: 1H>D>W<M. All in Bullish Zone.
EMAs: Widening Gaps amongst 20/ 50/ 100/ 200 levels on Weekly TF.
*Trail SL with Upside*
*Book Profit as per Risk Appetite*
*_Snapshot:_*
Amongst top lubricant mfg. in India.
31 New product launches with focus on SUV, EVs, Hybrids.
Growing Sales / Profitability on Qrtly / Yrly basis. Margins in Double Digits.
Low leverage, growing TNW. Improving WC Cycle, Assets Turnover.
Improved RoA / ROE / ROCE in FY24 vs. FY23.
Stable Promoter stake. Increasing FII/DII stake.
*_Concerns_*
Pricing power dependent on Crude price movement. Catering to Automotive sector.
*Do your own research as well. This is an Opinion*.
*_Happy Investing_*🤓

GULFOILLUBE Buy active above ATH / CUPGULFOILLUBE Buy active @ 1,144.00 and presents an opportunity for a long trade with a promising risk-reward profile. The strategy involves entering a position at 4% above the ATH and employing a dynamic stop-loss approach to manage risk and maximize potential gains.
Buy active at GULFOILLUBE's ATH price + 4% (1,144.00)
Initial Stop-Loss: Set an initial stop-loss at 20% below the entry price (915.20) or Weekly Swing Low
Targets:
First Target: 1,546.45 (Fibonacci 1.618 level)
Second Target: 1,822.40 (Fibonacci 2 level)
Third Target: 2,544.80 (Fibonacci 3 level)
Position Sizing: Limit the trade size to ensure that no more than 5% of your capital is at risk. In case the stop-loss is triggered, the maximum capital loss will be limited to 1%
The dynamic stop-loss adjustment after reaching the first target further protects capital and locks in profits.
The position sizing ensures that you are not risking more than you can afford to lose.
Disclaimer:
This trading strategy is for informational purposes only and should not be construed as financial advice. Please conduct your own research and due diligence before making any trading decisions.
Additional Notes:
Consider using technical indicators and chart patterns to refine your entry and exit points.
Monitor market conditions and adjust your strategy accordingly.
Practice risk management techniques to protect your capital.
Please let me know if you have any other questions.

Gulf Oil Lubricants India Limited is under breakout Gulf Oil Lubricants India Limited is under breakout . Consider buying only after getting a closing green candle above the trend line
Disclaimer: Education Purpose Only

GULFOILLUB looks good.GULFOILLUB looks good and made super setup.
This is only for educational purpose.

Trade idea in $GULFOILLUBHere we can see a LONG trade in NSE:GULFOILLUB as volume is added here and technicals will show a Long trade after a successful retest at our target level

gulfoil lubricant 3 year old trendline breakoutgulfoil lubricant 3 year old trendline breakout with huge sprut in volumes for swing target of 969 and 1041.

GULFOILLUB - Long Setup, Move is ON.....Stock name = Gulf Oil Lubricant INDIA Limited.
✅#GULFOILLUB trading above Resistance of 880
✅Next Resistance is at 1265
✅Moved 25% in 9 Weeks
Weekly chart setup
Chart is self explanatory. Levels of breakout, possible up-moves (where stock may find resistances) and support (close below which, setup will be invalidated) are clearly defined.
Disclaimer: This is for demonstration and educational purpose only. this is not buying and selling recommendations. I am not SEBI registered. please consult your financial advisor before taking any trade.

GULF OIL LUBRICANTGULFOIL is looking super solid, a very well rounding pattern breakout on monthly chart giving an indication of very long move.. stock is good fundamentally to ride for long. current level entry is good which broke the strong long time resistance...
Note: Please consult your financial advisor before any investment

GulfoillubStock name = Gulf Oil Lubricants INDIA Limited.
Weekly chart setup
Chart is self explanatory. Levels of breakout, possible up-moves (where stock may find resistances) and support (close below which, setup will be invalidated) are clearly defined.
Disclaimer: This is for demonstration and educational purpose only. this is not buying and selling recommendations. I am not SEBI registered. please consult your financial advisor before taking any trade.

SWING TRADE IDEAGULFOILLUB showing gud upside move inverted hammer at weekly resistance zone closed with gud volume and strong bullish candle. we can play this script for swing trade with the SL of inverted hammer low with little buffer.

Beautiful Triangle pattern breakout in monthly timeframeBeautiful Triangle pattern breakout in monthly timeframe.
Target 1 will be 20% around 750
Breakout already happened in Day timeframe.
Expecting a long term movement.
Bonus: Company announced 4% dividend

Gulf Oil Lubricant-Nice BreakoutGulf Oil Lubricant-Nice Breakout
Capital to be deployed- 20k
Investing Price -508-515
Breakout Price -502
Stoploss -463
Targets -585-672-878
Do retweet so that it helps someone
#Gulfoil #StocksInFocus #StocksToBuy #stockstowatch #StocksInNews #SwingTrading #BREAKOUTSTOCKS

GULF OIL LUBRICIANT WEEKLY CHART made short term bottom . accumulation going on with heavy volume . tgt 565/615

Long Term on GULF OIL LUBESWe can expect GULF OIL LUBES to make reversal here and start the upward movement with targets mentioned.
Wait for reversal in shorter timeframe before going long

GULF OIL LUBRICANTStock at lower valution
One time opportunity lifetime gain
Do your own analysis before investing
40/7/80/200% return is waiting


