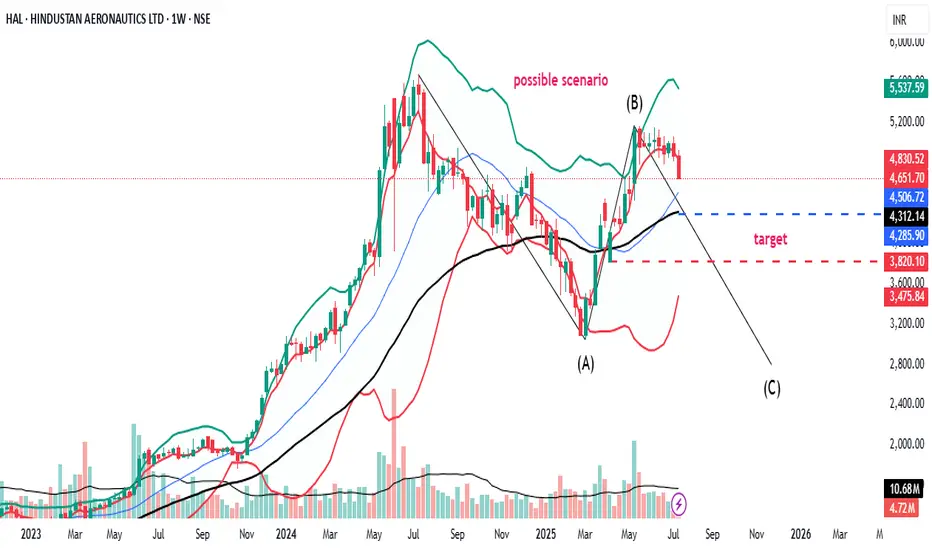
HAL bearish, Kindly do your own studyHAL is looking bearish on higher time frame.
Monthly price action is bearish
Monthly MACD is NCO stat
Weekly bearish price action. Price has broken last 8 weeks range. Looks like C wave is pending
Weekly MACD has given downtick
Weekly RSI is below 60
Daily price has challenged lowe bollinger band with good volume
Daily MACD is in NCO stat and below zero line
Daily RSI is below 40
Daily ADX is strong
HAL trade ideas
HAL: fake breakdown and a possible bullish move.Stock: Hindustan Aeronautics Ltd NSE:HAL
• Timeframe: 1-day candles (each candle represents one day of trading)
1. Consolidation Zone: A grey rectangular box highlights an area of "consolidation" starting from around May 14th. This means the stock price has been trading sideways within a relatively narrow range, not showing a clear uptrend or downtrend.
2. Fake Breakdown: An arrow points to a price dip below the lower boundary of the consolidation zone. The annotation calls this a "fake breakdown." This implies that the price temporarily moved below the support level, but then quickly bounced back up.
3. Potential Trade Setup: The chart suggests a potential long (buy) trade based on the fake breakdown and the subsequent recovery.
• Entry Point: Around 4,897.55 (labeled "ENTRY" on the chart) which is the price at which the stock could be bought.
• Stop Loss: Around 4,733.75 (likely intended to be the "4733.60")
This is the level below which the trader would exit the position to limit potential losses if the price moves against them.
• Targets: The chart identifies three potential profit targets:
* Target 1: 5,087.85
* Target 2: 5,305.15
* Target 3: 5,497.80

HAL - no wonder it is forming a FlagThe usual suspect among Defence Names in the country. Keep an eye out

accumulation phase if breakout will create new 52highConsolidation above 9ema and already bounched from 26ema


HAL - Target 3839.40 or 6159.20 ?Date: 19-05-2025
#HAL Current Price: 5016.3
Mid-Point: 4999.30
Upside Targets: 5426.46, 5662.10, 5910.65 and 6159.20
Downside Targets: 4572.97,4336.50, 4087.95 and 3839.40
Support: 4809.43
Resistance: 5190.83
#HAL
#HALChartAnalysis
#HALChartPatterns


tejas is ready to fly highcan look for a short oppurtunity in this. chart looks good sector is good and rising

HAL📈 Final Trade Plan – HAL
Component Value
Trade Direction BUY
Entry Price 4675
Stop Loss (SL) 4360
Risk ₹315
Target Price 7343
Reward ₹2668
Risk-Reward Ratio 8.5
Last High 5674
Last Low 3006
✅ Trade Strengths
✅ Strong Uptrend across all timeframes.
✅ HTF & MTF align – weekly and daily zones overlap with entry.
✅ RR is exceptional (8.5) – high potential reward with a tight SL.
✅ Previous high (5674) is well within first achievable zone before full target (7343).
⚠️ Watch Outs
⚠️ Entry is close to Daily Demand High (4883) – need price action confirmation.
🔻 Risk increases if buying late (if 4700+ is breached without pullback).
📊 Monthly zone is far below (2878–3428) – if market weakens, long-term value buy could emerge lower.
🎯 Trade Strategy Suggestions
🧠 Ideal entry around 4675 if price pulls back from resistance zone (4800+).
🔄 Consider a re-entry strategy if price dips to 4360–4400 again.
🧮 Set first target at 5674 (previous high) and trail the rest to 7343.
🔍 Monitor volume and bullish momentum on Daily/Weekly to validate move.
🛩️ HAL – Multi-Timeframe Demand Zone Analysis
🔷 Higher Timeframe (HTF)
Timeframe Trend Demand Zone Logic Proximal Distal Avg Zone
Quarterly UP BUFL 3428 3362 3395
📌 Insight: Quarterly demand is solidly in place and has already been respected in the past. Long-term bullish structure is intact and rising.
🔷 Medium Timeframe (MTF)
Timeframe Trend Demand Zone Logic Proximal Distal Avg Zone
Monthly UP BUFL 3428 2878 3153
Weekly UP BUFL 4675 4360 4518
Daily UP DMIP / Support 4883 4747 4815
MTF Avg 4329 3995 4162
📌 Insight:
Weekly and Daily zones are tight and fresh, providing a strong confluence around the Entry (4675).
Monthly demand zone lies much lower, so entry here assumes strength continuation (momentum-based).

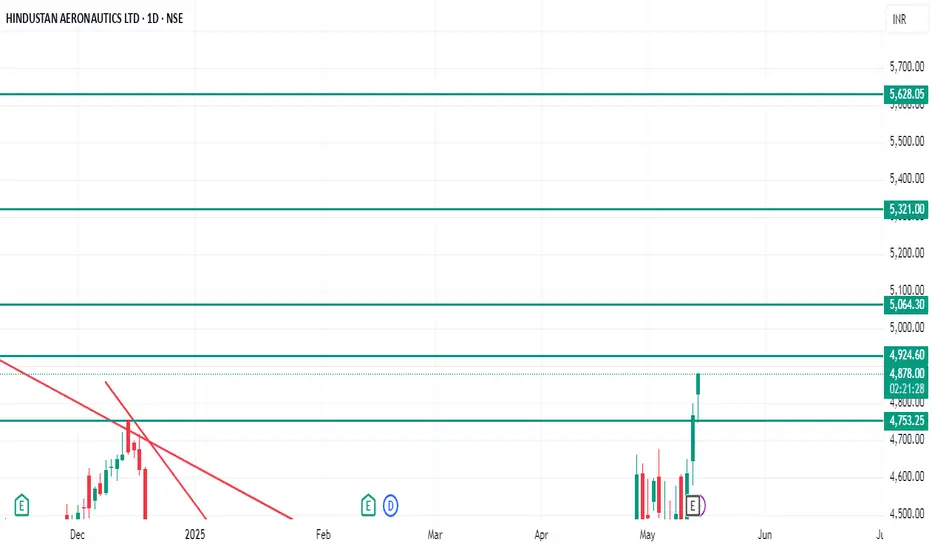
Go long in HALIt's a very good breakout in Hindustan aeronautics Ltd. 4755 was an important resistance in HAL on daily frame basis. Now it's breakout of this level. From here (CMP - 4877) we can expect upside targets in HAL: 4925,5065, 5320 & 5620.
Stoploss against this investment can be placed near 4740.
HAL -Hindustan Aeronautics Ltd. (45 minutes chart, NSE) - LongHAL -Hindustan Aeronautics Ltd. (45 minutes chart, NSE) - Long Position; short-term research idea.
Risk assessment: High {volatility risk}
Risk/Reward ratio ~ 2.05
Current Market Price (CMP) ~ 4740
Entry limit ~ 4665 on May 14, 2025
1. Target limit ~ 4780 (+2.47%; +115 points)
2. Target limit ~ 4880 (+4.61%; +215 points)
Stop order limit ~ 4560 (-2.25%; -105 points)
Disclaimer: Investments in securities markets are subject to market risks. All information presented in this group is strictly for reference and personal study purposes only and is not a recommendation and/or a solicitation to act upon under any interpretation of the letter.
LEGEND:
{curly brackets} = observation notes
= important updates
(parentheses) = information details
~ tilde/approximation = variable value
-hyphen = fixed value

Hindustan aeronautics Here is the English version, ready to copy:
---
This chart is of Hindustan Aeronautics Ltd (HAL). It shows a technical pattern known as the "Cup and Handle" pattern.
The chart shows a resistance zone around 4600–4700, which the stock has recently tested.
If the breakout is successful, an upward rally can be expected.
If you find this helpful and want more FREE forecasts in TradingView, Hit the 'BOOST' button
Drop some feedback in the comments below! (e.g., What did you find most useful?
How can we improve?)
Your support is appreciated!
Now, it's your turn!
Be sure to leave a comment; let us know how you see this opportunity and forecast.
Have a successful week
DISCLAIMER: I am NOT a SEBI registered advisor or a financial adviser. All the views are for educational purpose only

Hindustan Aeronautics LtdHAL CMP 4609.30 initial tgts done as expected
Now whats nxt closing abv 4614-4670-4683
can push upto 4800-5007-5180-5328 zones
Else will retest below zone 4279-4050-3853 Zone
View VAlid for nxt 7-21 trading sessions
Dtd : 30 April 2025

HAL Bullish ViewHAL is forming Inverted H&S in Daily Chart.
Looking at global Scenarios I am expecting a good upside movement

Go long in HAL above 4450 onlyGo long in HAL if it's closing above 4450 on daily frame. From there, we can expect targets of 4715, 4925 & 5625.
Keep in mind that condition is applied only 4450 closing on daily frame. Stoploss against this investment can be placed near 4120 or you can take any option CE.

"HAL: A Strong Investment Opportunity – Is Now the Right Time toHAL Investment Opportunity: Breakout from Consolidation – What’s Next?
Market Overview:
HAL has recently tapped a key weekly Point of Interest (POI) at ₹3,080 – ₹2,323 and rebounded strongly, confirming institutional buying at lower levels.
📌 All-Time High: ₹5,674
📌 Weekly POI Support Zone: ₹3,080 – ₹2,323
📌 Recent Price Action: After consolidating between ₹3,430 – ₹3,250 (Feb 18-24, 2025), HAL dropped, retested the POI, and formed a 7-day range between ₹3,500 – ₹3,350 before today's breakout.
📌 Technical Pattern: The price action resembles a Flag/Box Pattern, signaling a continuation of the uptrend.
Step-by-Step Investment Plan
1. Entry & Confirmation
✅ Ideal Entry:
If price retests the box range (₹3,500 – ₹3,350), it could offer a good buying opportunity.
Wait for confirmation (e.g., bullish price action or increased volume) before entering.
✅ Stop-Loss Strategy:
Place SL below the box range, i.e., ₹3,300 – ₹3,250, depending on risk appetite.
2. Profit Targets & Risk-Reward Ratio
📈 Profit Targets:
1️⃣ ₹3,750 – First swing target.
2️⃣ ₹4,055 – Second major target.
3️⃣ ₹4,055+ – If momentum continues, higher targets can be achieved.
📉 Risk-Reward Calculation:
Entry Zone (₹3,500 – ₹3,350)
Stop-Loss (Below ₹3,250)
Target 1 (₹3,750) → Risk-Reward Ratio ~ 2:1
Target 2 (₹4,055) → Risk-Reward Ratio ~ 3:1
3. Confirmation & Execution Strategy
🔹 Scenario 1 (Price Holds Above ₹3,500 – ₹3,350) – A successful retest of this level increases the probability of an upward move.
🔹 Scenario 2 (Price Dips Below ₹3,350 Before Rebounding) – This can act as a liquidity grab before a strong uptrend.
🔹 Scenario 3 (Price Fails to Hold Above ₹3,250) – This would invalidate the bullish setup, and investors should wait for a new structure formation.
Final Thoughts & Risk Management
✅ HAL is showing strong bullish continuation signs after a consolidation phase.
✅ Waiting for a pullback into the range could offer the best risk-reward entry.
⚠️ Always manage risk with a strict stop-loss to avoid downside surprises.
💡 Will HAL sustain its breakout and reach new highs, or is another pullback needed before the next move? Let’s analyze further! 🚀📊

Multiyear SupportAfter a strong corrections finally HAL stock price trading near multiyear support (Low risk zone for any stocks).


HAL is ready for next upside move HAL is down almost 36% from highs !!
Currently at good support area CMP 3700-3730
We may touch 4800-5000 levels in days to come !
Thank You !!

Hindustan Aeronautics Ltd (HAL)Short term investment opportunity in Hindustan Aeronautics Limited (HAL).
We can invest from current level 50% qty and remaining 50% qty from 3312. Both zones are looking like a strong institutional buying zone.
Invest at your own risk. I am not SEBI registered .

Hindustan Aeronautics Ltd ( HAL )Short term investment opportunity in Hindustan Aeronautics Limited (HAL).
We can invest from current level 50% qty and remaining 50% qty from 3312. Both zones are looking like a strong institutional buying zone.
Invest at your own risk. I am not SEBI registere.

HAL RSI Divergencemost of the stock showing RSI divergence on Daily Basis
Like BEL also
RSI above 60 on monthly basis
RSI taken support 40 on weekly basis
Budget expectation ?

HAL - PARABLIC BULLISHNSE:HAL Weekly parabolic setup with location and accumulation may continue further rally till 11000.
