HARSHAHARSHA
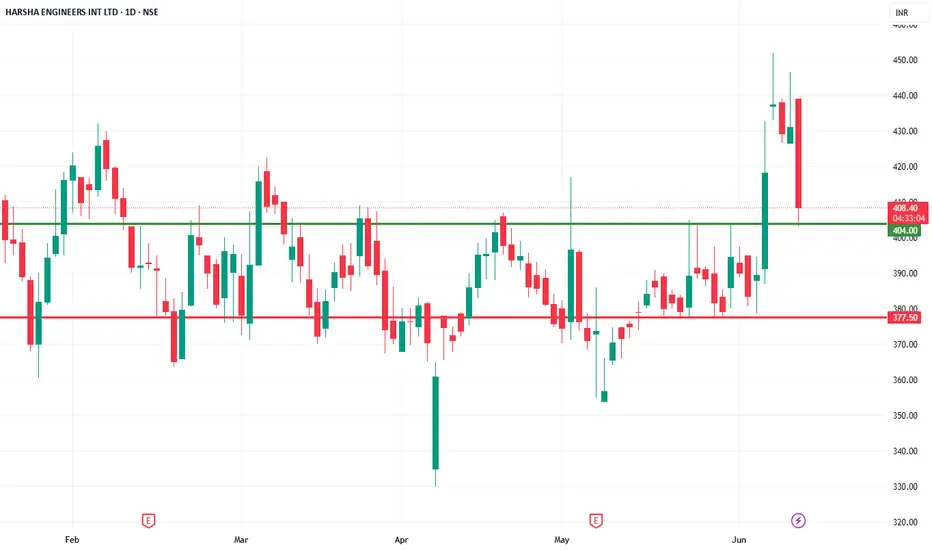
watch above levels. green line is our entry, redline is our SL.
DISCLAIMER : I am NOT a SEBI registered advisor or a financial adviser. All the views are for educational purpose only.
HARSHA trade ideas
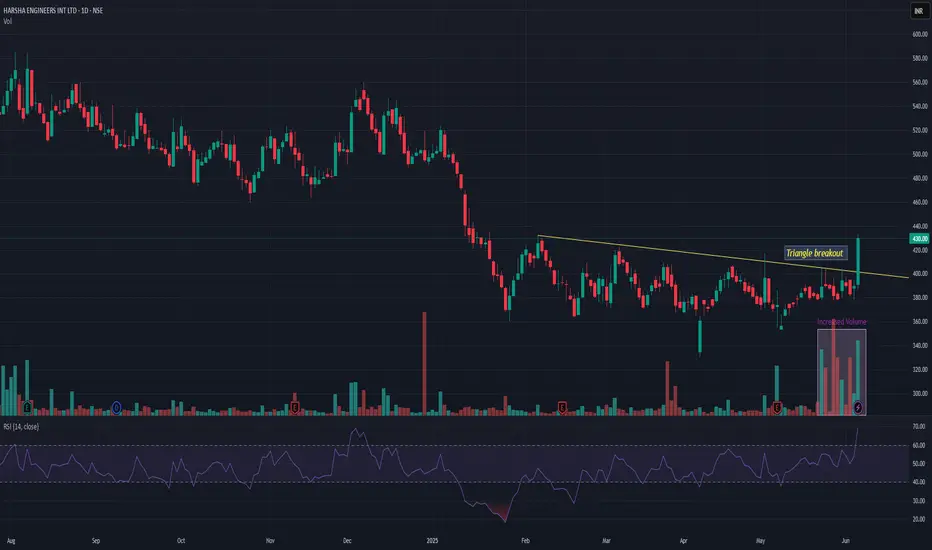
HARSHAHARSHA giving triangle breakout with decent volume. It is coming out of long 5 months consolidation. 400 seems good support. HARSHA may give momentum rally in nr future with resistance near 510.
HARSHA Trading Within Demand ZoneHARSHA is currently trading at ₹489.2, which is above the demand zone of ₹487 to ₹480, formed on 27th November 2024. This suggests potential support in this range, and investors might watch for price action near this zone.
Disclaimer: This analysis is for informational purposes only and should not be considered as financial advice. Please conduct your own research or consult a financial advisor before making any investment or trading decisions.

Harsha engineering good swing pick?Harsha engineering from fundamental pov company is debt free and has delivered a good cagr return
Now stock is at good value looks like in mid of Jan month it will pop up with good volume
Risk traders can accumulate at cmp keeping sl at 475 almost 8% while safe trader can accumulate at 485-515
Tgt 562 598 676 720
Only for educational purposes
Ask your financial advisor and broker before buying

HARSHA ENGINEERS INT LTD S/RSupport and Resistance Levels:
Support Levels: These are price points (green line/shade) where a downward trend may be halted due to a concentration of buying interest. Imagine them as a safety net where buyers step in, preventing further decline.
Resistance Levels: Conversely, resistance levels (red line/shade) are where upward trends might stall due to increased selling interest. They act like a ceiling where sellers come in to push prices down.
Breakouts:
Bullish Breakout: When the price moves above resistance, it often indicates strong buying interest and the potential for a continued uptrend. Traders may view this as a signal to buy or hold.
Bearish Breakout: When the price falls below support, it can signal strong selling interest and the potential for a continued downtrend. Traders might see this as a cue to sell or avoid buying.
MA Ribbon (EMA 20, EMA 50, EMA 100, EMA 200) :
Above EMA: If the stock price is above the EMA, it suggests a potential uptrend or bullish momentum.
Below EMA: If the stock price is below the EMA, it indicates a potential downtrend or bearish momentum.
Trendline: A trendline is a straight line drawn on a chart to represent the general direction of a data point set.
Uptrend Line: Drawn by connecting the lows in an upward trend. Indicates that the price is moving higher over time. Acts as a support level, where prices tend to bounce upward.
Downtrend Line: Drawn by connecting the highs in a downward trend. Indicates that the price is moving lower over time. It acts as a resistance level, where prices tend to drop.
Disclaimer:
I am not a SEBI registered. The information provided here is for learning purposes only and should not be interpreted as financial advice. Consider the broader market context and consult with a qualified financial advisor before making investment decisions.

Harsha EngineeringWith the incoming volume, breaking out of multiple important levels, which includes consolidation and gann levels

HARSHA ENGINEERSHarsha engineers breakout ATH TGT upto 882 SL bellow 445
and This is only for educational purpose

Harsha Engeneers Horizontal Breakout with volumeThis is a recently listed stock which has given BO with volume.

HARSHA ENGINEERS INTERNATIONAL LTDCompany is almost debt free.
Company has delivered good profit growth of 56.4% CAGR over last 5 years
The combined share of operating losses at China and Romania came down significantly because of China
reporting positive profit in Q4 FY 2024. However, Romania continued to report operating losses in Q4 FY
2024.
➢ While the demand situation in Europe both on the Wind as well as on the Industrial front remains
subdued, our strategy in Romania is to improve product mix by increasing the share of cages, which is
aimed at bringing Romania to Break-even level in FY 2025.
➢ Solar Business has reported a decent growth in top-line as well as profitability, on the back of a
favourable renewable policy regime, with our strategy continued to be on limited capital allocation in this
segment, but still allowing the same to operate in its natural tangent.
➢ The progress on our Greenfield project is satisfactory and is expected to commission in FY 2025.
On a consolidated basis Q4 FY 2024 was the strongest quarter in the current fiscal FY 2024 reflecting an allround
improvement in the top line as well as the EBITDA and PAT margins. The consolidated top line of Q4
FY 2024 has shown a growth of 17% over Q3 FY 2024 and 11% over Q4 FY 2023. The consolidated EBITDA of
Q4 FY 2024 has also grown by 23% as compared to Q3 FY 2024 and 10% as compared to Q4 FY 2023.
➢ On full year basis, while consolidated top line of FY 2023-24 reflects a marginal growth over FY 2022-23, the
EBITDA and PAT of FY 2024, though lower than FY 2023, are still reflecting a significant recovery as
compared to H1 FY 2024 and are better than our expectations.
➢ The growth in Bushing business as well as additional demand growth due to China + 1 factor was in line with
our expectations. The Progress on outsourcing projects (insourcing to outsourcing) was satisfactory, and the
growth in Japan based customers’ segment, though slightly muted, has remained positive.
➢ The expected growth in large size bearing cages segment could not be achieved due to continued global
slowdown in the Wind as well as Industrial Segment, but is expected to catch up next Fiscal.

Strong Candle on chart The chart looks very strong, we going to wait till cross the hurdle and after that, we will going to hit the trade.
In this blood bath around the market. This script is going in the opposite direction.
Happy trading.

Harsha Engineering (NSE)breakout of Cup and Handle in stock on weekly and monthly charts
Target 600 in 9 to 12 months
Sl Closing below 430 on WCB

Harsha EngineersIt appears favorable for the price to close in proximity to the Trendline that originated from its listing date. There is an influx of trading volume, and the daily candle concluded within the new Fann angle.

HARSHA ENGHI,
The latest ipo clocked gains on listing as expected with a whopping 36% premium,This is just my view (analysis) is just a test of counting candle sticks once after or within 16-17 candkesticks if i am right by the given numbers dot to dot by anyside, just my part of research with number of candles see the specialisation of nos3 6 9 11 13 17 19 24 33 34 66 82 161 168 check with your charts.These ll b magical numbers you can see it any timeframe from One minute to Monthly charts.But this TIME it's different i ll try with only one candle stick without any data on the left side.Next time i ll give detail analysis with nifty charts with a great magical no .
This is my first time,Sorry in Advance for typo error or writing
Disclosure : I am not SEBI registered.The information provided here is for education purposes only.I will not be responsible for any of your profit/loss with this channel suggestions.Consult your financial advisor before taking any decisions.This is neither advice nor endorsement.
Twitter :@Ranjith0431
Ranjith Kothari
Thank you.

Harsha? engineering a base?Harsha looks like is creating a base 400 to 412, a good volume BO with close above 425 will give wings to this counter.
