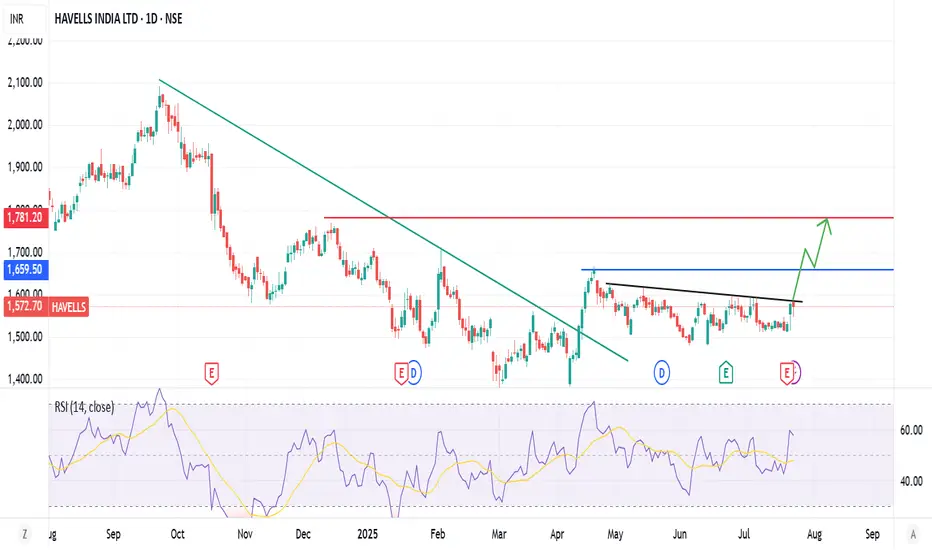
havells awaiting for break out havells making constant hitting on resistance, lets hope for good out come.
HAVELLS trade ideas
Review and plan for 23rd July 2025Nifty future and banknifty future analysis and intraday plan.
Quarterly results.
This video is for information/education purpose only. you are 100% responsible for any actions you take by reading/viewing this post.
please consult your financial advisor before taking any action.
----Vinaykumar hiremath, CMT

HAVELLS INDIA LTDHavells delivered 55% returns over 1 year and touched high price of 1985, and currently trading around 1845 levels
Stock is in bullish trend and at good support levels to take entry
stock can be accumulated in dips up to 1687 levels
Price Targets
First - 1985 (7.5 % up side potential from CMP)
Second - 2113 (14.5 % up side potential from CMP)
Third - 2375 (28.7% up side potential from CMP)
Stoploss - 1558 (15.5% down side risk from CMP)
Strong up move is envisaged based on the RSI & 21 EMA
This idea is only for education purpose and not for real time investing or trading. Kindly consult your financial adviser before trading or investing with real money

Havells India - Tend ChangeNSE:HAVELLS Trend has changed. 1st Target would be 1782 and this can go upto 1960, if it sutains, which is Risk Reward. However if you are planning for the 1960, please keep stop loss as 1782 and proceed. This is to ensure you get the Virtual Money for which you have put your efforts!!


Havells India Ltd view for Intraday 24th April #HAVELLS Havells India Ltd view for Intraday 24th April #HAVELLS
Resistance 1630 Watching above 1633 for upside movement...
Support area 1600 Below 1600 ignoring upside momentum for intraday
Watching below 1595 for downside movement...
Above 1630 ignoring downside move for intraday
Charts for Educational purposes only.
Please follow strict stop loss and risk reward if you follow the level.
Thanks,
V Trade Point


Trade Idea for HAVELLS INDIA LTDTimeframe: 4H Chart
Technical Analysis:
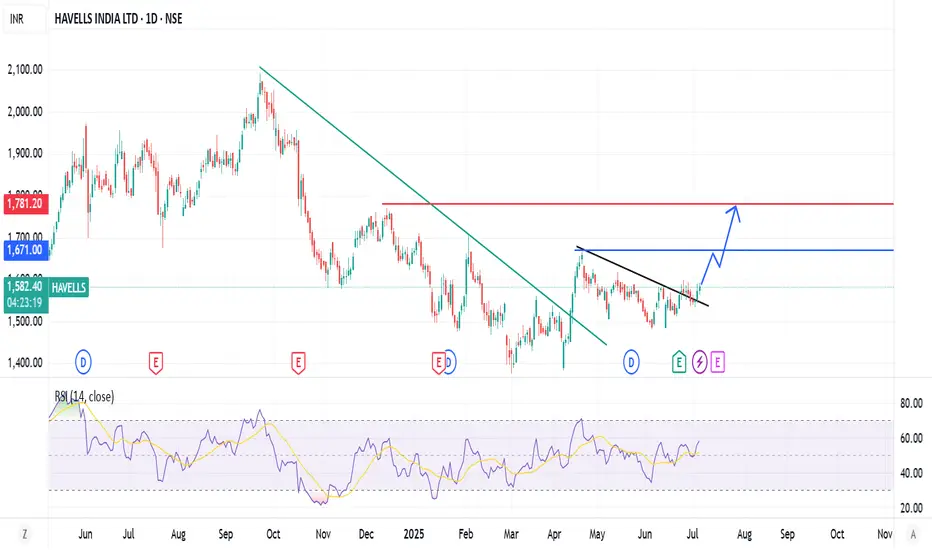
Falling Channel Breakout Setup : The stock has been trading inside a downward-sloping channel. A breakout from this channel could lead to a strong upward move.
Key Levels:
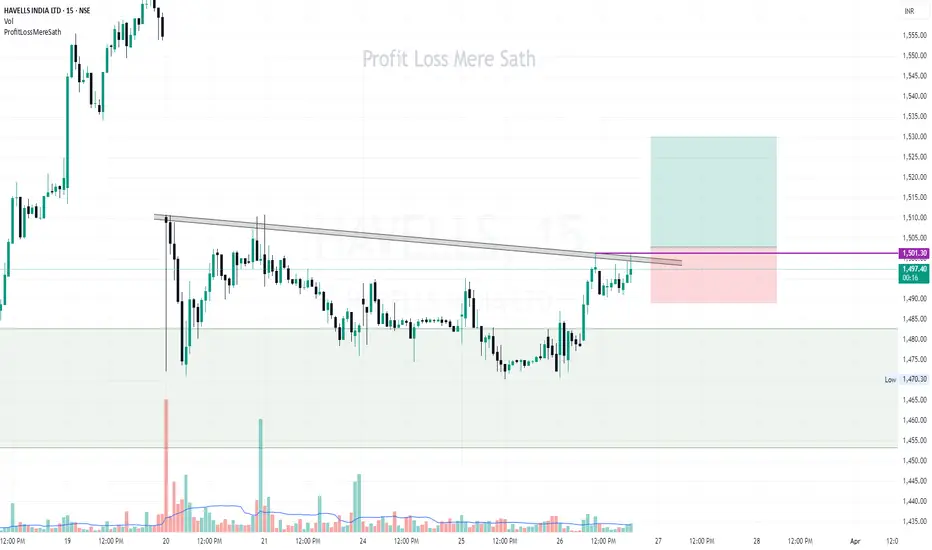
Entry Zone: Around ₹1,540 - ₹1,560 (Breakout confirmation above resistance).
Stop Loss (SL): Below ₹1,468 (Last swing low).
Target Levels (T1, T2, T3):
T1: ₹1,680 (First resistance zone).
T2: ₹1,760 (Major resistance).
T3: ₹1,920 (Previous high zone).
RSI Indicator: The RSI is recovering from the oversold region, indicating bullish momentum.
Volume Analysis: Volume is increasing, which supports the possibility of a breakout.
This setup presents a bullish breakout trade from a falling channel with potential upside targets of ₹1,680, ₹1,760, and ₹1,920. A stop-loss below ₹1,468 is recommended to manage risk.


HAVELLS : Connecting for recoveryHavells India Ltd. (HAVELL’S) - Bullish Reversal Zones & Targets
Key Levels and Zones :
Current Price: ₹1,649.90 (-₹26.50, -1.58%)
Support and Buying Zones:
Extended Retracement Zone: ₹1,574.50 - ₹1,632.95
Golden Retracement Zone: ₹1,629.30 - ₹1,683.35
Target Zones:
First Target Zone: ₹1,821 - ₹1,839
Second Target Zone: ₹1,994.00
Stop Loss: ₹1,594.55
Chart Analysis :
Wave Patterns: The chart showcases an ABC correction pattern suggesting a potential bullish move.
Wave A: Initial decline marking the first corrective phase.
Wave B: Temporary upward movement.
Wave C: Anticipated upward rally within the target zones.
Volume Activity: High trading volume at 548.91K indicates significant market interest.
Trade Plan :
Entry Point:
Long positions can be considered within the extended retracement zone (₹1,574.50 - ₹1,632.95) or the golden retracement zone (₹1,629.30 - ₹1,683.35).
Targets:
First Target Zone: ₹1,821 - ₹1,839.
Second Target Zone: ₹1,994.00 for extended gains.
Stop Loss: Place a stop loss at ₹1,594.55 to manage downside risk.
Conclusion :
The daily chart of Havells India Ltd. identifies critical support and resistance levels, creating a robust framework for strategic trading. Traders can capitalize on potential bullish reversals for profitable opportunities while maintaining a favorable risk-reward ratio.
Disclaimer: This analysis is for educational purposes only and does not constitute financial advice. Always perform your research or consult with a financial advisor before investing.
#HavellsIndia #TradingPlan #ABCPattern #TechnicalAnalysis #StockMarket


HAVELLS : Idea for Future/Options TradeHAVELLS INDIA LTD (HAVELLS): Potential Bullish Reversal 🚀
Price Action Overview:
Current price: ₹1,708.25 , hovering near a critical demand zone between ₹1,700.30–₹1,708.25 .
Previous swing low highlights strong buying interest in this region, where prices have historically reversed.
Consolidation observed within the retracement zone, indicating potential for a bullish reversal.
Key Levels:
Demand Zone: ₹1,700.30–₹1,708.25
A critical area where buyers are likely to step in.
Price action in this zone will determine the trade direction.
Stop Loss: ₹1,692.10 (Hourly close below invalidates the demand zone).
First Target Zone: ₹1,799–₹1,816 (Resistance area likely to trigger profit booking).
Trading Strategy:
Entry Plan:
Look for bullish confirmation patterns such as a bullish engulfing candlestick or hammer near ₹1,700.30–₹1,708.25 .
Stop Loss:
Place a stop loss at ₹1,692.10 to limit downside risk.
Profit Target:
First target: ₹1,799–₹1,816 , offering a strong risk-reward ratio.
Risk Management Tips:
Avoid chasing prices; wait for stabilization within the demand zone.
Stick to predefined stop-loss levels and never risk more than 2% of your capital on a single trade.
Monitor broader market sentiment, as sector performance can influence price action.
Potential Risks:
A breach below ₹1,692.10 could lead to deeper retracement or continuation of the downtrend.
Market-wide trends or adverse sectoral news may impact the stock's movement.
Disclaimer:
This analysis is for educational purposes only. I am not a SEBI-registered analyst. Please perform your own research or consult with a financial advisor before making trading decisions.
#HAVELLS #StockTrading #TechnicalAnalysis #DemandZone #SwingTrading #MarketInsights

Havells India Ltd view for Intraday 4th October #HAVELLS Havells India Ltd view for Intraday 4th October #HAVELLS
Buying may witness above 2002
Support area 1980. Below ignoring buying momentum for intraday
Selling may witness below 1949
Resistance area 1980
Above ignoring selling momentum for intraday
Charts for Educational purposes only.
Please follow strict stop loss and risk reward if you follow the level.
Thanks,
V Trade Point


SWING IDEA - HAVELLS INDIAHavells India , a leading electrical equipment company, is presenting a promising swing trade opportunity.
Reasons are listed below :
Breakthrough of Resistance Zone : The 1450-1500 zone has historically been a strong resistance area. The price has broken through, retested, and is now again breaking previous higher highs, indicating a potential upward momentum.
Bullish Marubozu Candle on Weekly Timeframe : A Marubozu candle, which lacks upper and lower shadows, shows strong bullish sentiment, suggesting continued buying pressure.
Breaking a Long Consolidation Phase : Havells India has emerged from a consolidation phase that lasted over 2.5 years, indicating a potential bullish trend ahead.
Trading Above Key Moving Averages : The stock is trading above the 50 and 200 exponential moving averages on the weekly timeframe. This is a strong indication of a prevailing upward trend.
Higher Highs : The stock is forming higher highs, suggesting that it is in a consistent uptrend and may continue to climb.
Trading at All-Time High : While this indicates a bullish outlook, it is important to monitor the price action for any signs of exhaustion or potential pullbacks.
Target - 1900 // 2100
Stoploss - weekly close below 1450
Disclaimer :
Decisions to buy, sell, hold or trade in securities, commodities and other investments involve risk and are best made based on the advice of qualified financial professionals. Any trading in securities or other investments involves a risk of substantial losses. The practice of "Day Trading" involves particularly high risks and can cause you to lose substantial sums of money. Before undertaking any trading program, you should consult a qualified financial professional. Please consider carefully whether such trading is suitable for you in light of your financial condition and ability to bear financial risks. Under no circumstances shall we be liable for any loss or damage you or anyone else incurs as a result of any trading or investment activity that you or anyone else engages in based on any information or material you receive through TradingView or our services.
@visionary.growth.insights


HAVELLS S/R for 19/9/24Support and Resistance Levels:
Support Levels: These are price points (green line/shade) where a downward trend may be halted due to a concentration of buying interest. Imagine them as a safety net where buyers step in, preventing further decline.
Resistance Levels: Conversely, resistance levels (red line/shade) are where upward trends might stall due to increased selling interest. They act like a ceiling where sellers come in to push prices down.
Breakouts:
Bullish Breakout: When the price moves above resistance, it often indicates strong buying interest and the potential for a continued uptrend. Traders may view this as a signal to buy or hold.
Bearish Breakout: When the price falls below support, it can signal strong selling interest and the potential for a continued downtrend. Traders might see this as a cue to sell or avoid buying.
20 EMA (Exponential Moving Average):
Above 20 EMA: If the stock price is above the 20 EMA, it suggests a potential uptrend or bullish momentum.
Below 20 EMA: If the stock price is below the 20 EMA, it indicates a potential downtrend or bearish momentum.
Trendline: A trendline is a straight line drawn on a chart to represent the general direction of a data point set.
Uptrend Line: Drawn by connecting the lows in an upward trend. Indicates that the price is moving higher over time. Acts as a support level, where prices tend to bounce upward.
Downtrend Line: Drawn by connecting the highs in a downward trend. Indicates that the price is moving lower over time. It acts as a resistance level, where prices tend to drop.
RSI: RSI readings greater than the 70 level are overbought territory, and RSI readings lower than the 30 level are considered oversold territory.
Combining RSI with Support and Resistance:
Support Level: This is a price level where a stock tends to find buying interest, preventing it from falling further. If RSI is showing an oversold condition (below 30) and the price is near or at a strong support level, it could be a good buy signal.
Resistance Level: This is a price level where a stock tends to find selling interest, preventing it from rising further. If RSI is showing an overbought condition (above 70) and the price is near or at a strong resistance level, it could be a signal to sell or short the asset.
Disclaimer:
I am not a SEBI registered. The information provided here is for learning purposes only and should not be interpreted as financial advice. Consider the broader market context and consult with a qualified financial advisor before making investment decisions.


