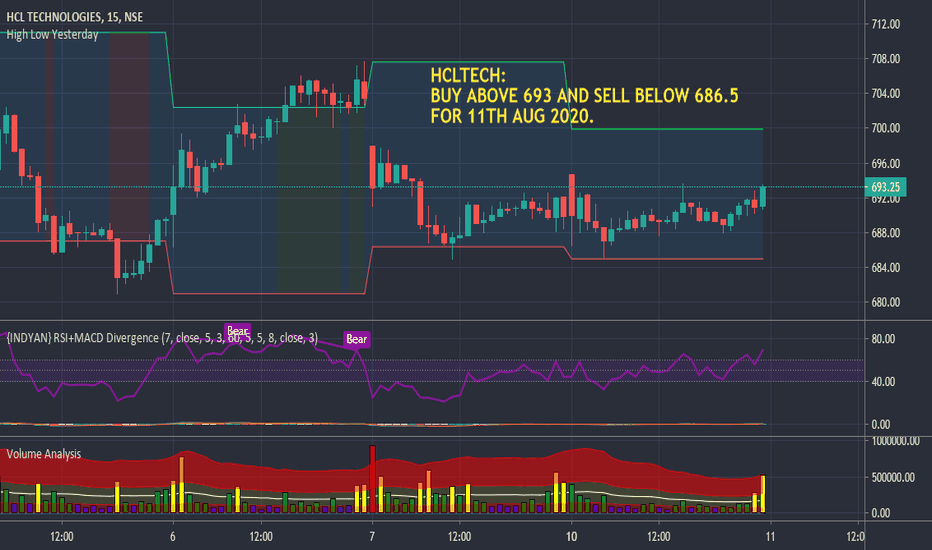
#HCLTECH #SHORT 10 AugustHCLTECH in downtrend as per Trendline , RSI , MACD and MA as well so it is strong bearish, RSI 14- 62.75, MACD- 29.61 in downward, so we can go for short on 10 August. If you found this post helpfull so please Like and encourage.. Follow to get more updates.by omgautam982
HCLTECH - FOLLOWER REQUESTLEVELS FOR REFERENCE NSE:HCLTECH ****************************************************************************************************************************************************************** Hi all, Its pleasure to have you all here. I have started putting these charts as a contribution from my side to all people who are new to business, as I had to struggle a lot without any sources at disposal. So please consider this a just small contribution from my side. Few Honest Disclosures: 1. Any idea shared is my personal view, its not a recommendation, neither any kind of paid propaganda, so please do your bit of research. 2. Ideas shared does not mean that I trade all or have position in them, this is just a helping hand to all. 3. I expect no comments or like nor any negativity, as I said its just a small helping hand from my side, please plan your risk and trade as per your capacity. 4. To trade in Cash, options or futures is your sole choice and your own risk 5. I am no expert in Tech Indicators, I believe in support resistance and trendline theory, you may use this as a supplement theory for better results. 6. I work for my own living, this is a hobby which I do sincerely to help anyone who might come across my charts. ***********************************************************************************************************************************************by akkshay11Updated 2
HCL tech at 31 July 2020HCL has given a great breakout as expected with good earning report it sky rocketed ... For some time the stock is in consolidation mode ===> also overbought mfi multiple times Major Resistance 720 Major Support 690 these two are to be watch and closing in atleast hourly or 4h important ... not expecting Resistance to break ---> personally expecting a breakdown ( retracement ) till 660 zone Option Strategy -> no such good strategy comes in mind ... by Trade_with_yash1
Hcl Technologies Ltd (Hcltech - NSE) - stay long Hcl Technologies Ltd (Hcltech - NSE) has extended 5th wave, so stay long if price gaps down near 692 as 4th subwave of 3rd of 5th wave, for new high as target around 725-35 zone. It sector itself is a stronger in last move and continue its gain. Longby EWFcw4
HCLTECHNSE:HCLTECH With markets poised to fall tomorrow, IT seems a good bet, so if someone is long in this, remember the support of 692. If it goes below that and sustains, u can see levels of 683 and 673, on upside 699, 704 and above ***CAREFUL*** - its a small timeframe chart, be cautious ********************************************************************************************************************************************* Hi all, Its pleasure to have you all here. I have started putting these charts as a contribution from my side to all people who are new to business, as I had to struggle a lot without any sources at disposal. So please consider this a just small contribution from my side. Few Honest Disclosures: 1. Any idea shared is my personal view, its not a recommendation, neither any kind of paid propaganda, so please do your bit of research. 2. Ideas shared does not mean that I trade all or have position in them, this is just a helping hand to all. 3. I expect no comments or like nor any negativity, as I said its just a small helping hand from my side, please plan your risk and trade as per your capacity. 4. To trade in Cash, options or futures is your sole choice and your own risk 5. I am no expert in Tech Indicators, I believe in support resistance and trendline theory, you may use this as a supplement theory for better results. 6. I work for my own living, this is a hobby which I do sincerely to help anyone who might come across my charts. ***********************************************************************************************************************************************by akkshay11Updated 113
HCL IS AT A VERY IMPORTANT LEVEL!!HCL IS AT A VERY IMPORTANT LEVEL OF 695. LET IT BREAK AND SUSTAIN TARGETS CAN BE 705--711 LEVELS & TARGETS AS PER CHART HAHAHA LET'S GO JAI HIND!!Longby CashKingV3
Trend Setup of HCL with Elliote Wave You will find me on my bio Stocks Might Bearish Below 574 for Target Toward 550-5640-520. Thanks Shortby Trading_buddyUpdated 8
HCLTECH No More StrengthNSE:HCLTECH If you can see HCLTECH getting narrowing down its movement as its going up. And last couple of days its also not showing any strong bullish closing on Daily and 1H chart. Volume is also indicating professionals are now not interested in higher prices. We may consider this as weak stock now which may fall or best say it will show some retracement towards down sider. I will consider this stock bearish only if it gives solid closing below 644 on 1H chart. This bearish view will become invalid only above 662 closing basis.Shortby PriceVolumeRider1
Pattern of the Day- Ascending TriangleGood momentum will be seen on breakout at the marked levels ahead of Quarterly results. Only buy when volume is heavy on breakout.Longby Prayas2
HCLTECH - Result announcement tomorrow - Created Doji#HCLTECH Quarter result will come tomorrow. Stock today Hit the 52 week High. but stock created a big doji and closed above the resistance line. Stock will be volatile for tomorrow. Level 640 & 650 has strong OI buildup compare to 620 and 610 level. Showing Bullish result in Technical Parameter: CCI in overbought zone MACD is treading UP above 0 RSI near to overbought zone William R% is bearish Stoch reversing from overbought zone MFI in overbought zone ATR is decreasing since 5 day Aggressive New Long ---------------------------------------------------------- Support : 585 Breakdown : 600 LTP : 627.65 Breakout : 653 Short Target : 700 ---------------------------------------------------------- Positive & Negative Point: 1) Very Bullish in Daily/Weekly/monthly chart 2) Relative Strength - Benchmark index is increasing ---------------------------------------------------------- (Disclaimer: This is only for educational purpose and paper treading.)by singajaiUpdated 5
First Female Head for an India IT Co. Having a quick gander at this one and it looks like the price discovery is still on going . think another 2 days before this flag or possible descending triangle play out either way SL 611 targeting just shy of 700 however we might just go up further .. Longby CompoundingGain3
Long HCL Idea A declining wedge is formed so when the stock breaks out of it should hit those black lines which can be used for targets, Stop loss can be kept seeing the breakout keep the big momentums candle low as stoploss by UmeshKannaUpdated 226
HCLTECHNSE:HCLTECH IT Sector is in buzz, also results are there in coming days, hence it seems to be in upmove. It can be entered with a sl of 594 for targets of 613 and 623, and beyond that further upside. ********************************************************************************************************************************************** Hi all, Its pleasure to have you all here. I have started putting these charts as a contribution from my side to all people who are new to business, as I had to struggle a lot without any sources at disposal. So please consider this a just small contribution from my side. Few Honest Disclosures: 1. Any idea shared is my personal view, its not a recommendation, neither any kind of paid propaganda, so please do your bit of research. 2. Ideas shared does not mean that I trade all or have position in them, this is just a helping hand to all. 3. I expect no comments or like nor any negativity, as I said its just a small helping hand from my side, please plan your risk and trade as per your capacity. 4. To trade in Cash, options or futures is your sole choice and your own risk 5. I am no expert in Tech Indicators, I believe in support resistance and trendline theory, you may use this as a supplement theory for better results. 6. I work for my own living, this is a hobby which I do sincerely to help anyone who might come across my charts. ***********************************************************************************************************************************************Longby akkshay11Updated 4
HCL TECH near to rectangle breakout - Very Bullish - Level#HCLTECH is moving under rectangle box and near to upper breakout. Today stock gain Volume more then 20VMA. Stock is moving above 200SMA and 200EMA both. Showing Bullish in all indicator: Increase in Relative strength - Benchmark Index CCI above +100 RSI is trending UP MFI is trending UP ROC is trending UP Stoch in overbought MACD crossed above signal line Aggresive New Long Making Higher High since 3 day ---------------------------------------------------------- Support : 570 and 546 Breakdown : 580 CMP : 592 Breakout : 600 Short Target : 614 and 623 ---------------------------------------------------------- (Disclaimer: This is only for educational purpose.)Longby singajaiUpdated 114
HCLTECH long - SetupNSE:HCLTECH gave a flag breakout but has resistance going ahead. A close above 582 will put it in rocket.Longby akashboddeda2
HCLTECH - GO SHORT @ 605 FOR A RR OF 1:7 BY 10 AUGUSTHCLTECH - GO SHORT @ 605 WITH A SL OF 635 AND A TARGET OF 400. TARGET SHOULD BE ACHIEVED BY 10 AUGUST 2020Shortby anshusahay2
HCLTECHBuy above 590 for a target of 606 and 618 Sell if reverses from 578 levels for 573 567 555by akkshay11Updated 6