HDFCLIFE trade ideas


HDFC LIFE: 17 AUG 20: RSI DIVERGENCE IS IN DAY CANDLEHDFC LIFE: 17 AUG 20:
RSI DIVERGENCE IS IN DAY CANDLE SO I EXPECT A GOOD UPTREND IN THIS.
IF OPEN AT 590 ABOVE THEN EXPECT TO 594.


HDFCLIFE LOOKS EXHAUSTEDPLEASE SEE CHART FOR DETAILS.
TARGET 1 : 580
STOP LOSS : 650
**These are my personal observations. Please trade at your own risk.**

599 BUY TARGETING NEW 621 & ATHGutted missed out on TATA consumer today however happy with the past few scalps in Intra .This one looks good for max leveraged day trade trying to scan for setups with a higher probability of a big move .
This looks like a nice risk /reward and sitting just above decent support attempting for the 6th time to break resistance of 646 and target new high's.
Stop loss 589.65 if your're swinging other wise for intra hop on if it dips a bit on open .
On the daily 50 day has just crossed the 99 and 200 to the upside just feel price discovery for this should be fun :)
Keep a target in mind , keep a SL in place and be patient with your entry and exit... emotions get to the best of us but if you have some sort of plan it helps remove emotion aka fear !!!
Cheers!


HDFCLIFENSE:HDFCLIFE
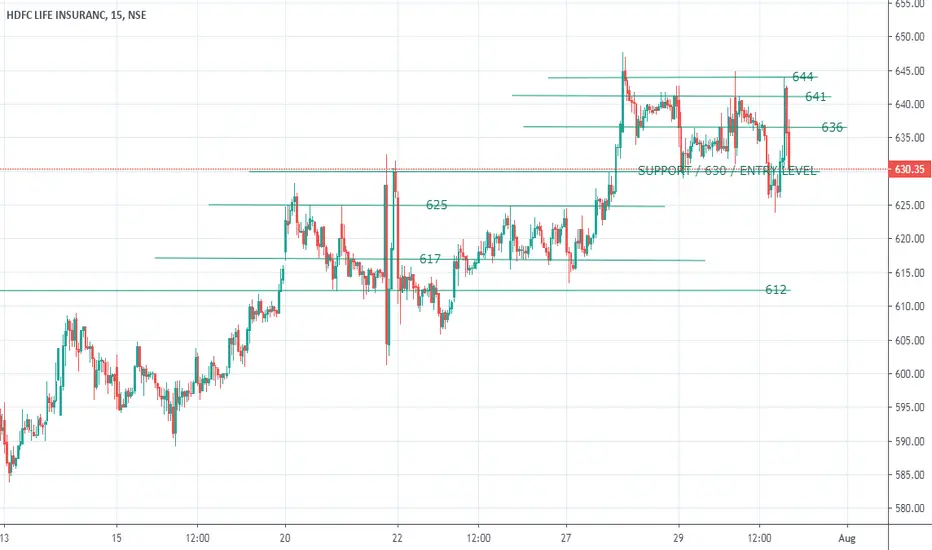
IT HAS CLOSED NEAR ITS SUPPORT OF 630, THE LEVELS HAVE BEEN MARKED ON BOTH SIDES FOR ENTRY FOLLOW THE ENTRY LEVELS AND TRADE DIRECTIONALLY.
*********************************************************************************************************************************************
Hi all,
Its pleasure to have you all here.
I have started putting these charts as a contribution from my side to all people who are new to business, as I had to struggle a lot without any sources at disposal. So please consider this a just small contribution from my side.
Few Honest Disclosures:
1. Any idea shared is my personal view, its not a recommendation, neither any kind of paid propaganda, so please
do your bit of research.
2. Ideas shared does not mean that I trade all or have position in them, this is just a helping hand to all.
3. I expect no comments or like nor any negativity, as I said its just a small helping hand from my side, please plan your risk and trade as per your capacity.
4. To trade in Cash, options or futures is your sole choice and your own risk
5. I am no expert in Tech Indicators, I believe in support resistance and trendline theory, you may use this as a supplement theory for better results.
6. I work for my own living, this is a hobby which I do sincerely to help anyone who might come across my charts.
********************************************************************************************************************************************************************************************************************************************************************************************
Hi all,
Its pleasure to have you all here.
I have started putting these charts as a contribution from my side to all people who are new to business, as I had to struggle a lot without any sources at disposal. So please consider this a just small contribution from my side.
Few Honest Disclosures:
1. Any idea shared is my personal view, its not a recommendation, neither any kind of paid propaganda, so please
do your bit of research.
2. Ideas shared does not mean that I trade all or have position in them, this is just a helping hand to all.
3. I expect no comments or like nor any negativity, as I said its just a small helping hand from my side, please plan your risk and trade as per your capacity.
4. To trade in Cash, options or futures is your sole choice and your own risk
5. I am no expert in Tech Indicators, I believe in support resistance and trendline theory, you may use this as a supplement theory for better results.
6. I work for my own living, this is a hobby which I do sincerely to help anyone who might come across my charts.
***********************************************************************************************************************************************
HDFC LIFE LONG TRADEScrip Name: HDFC LIFE
Time Frame: Daily
EMA: 50 (Black) and 200 (Orange)
Observations:
1. Golden Crossover in progress; expected to complete in the current week
2. Volumes supporting current bullish trend
3. Resistance seen at 601 and 615 levels from previous trading days
4. Support seen at 555 levels
Entry: Above 582.5
Target: 637
SL: 555

HDFCLIFE,Triple Top KEY TAKEAWAYS
A triple top is formed by three peaks moving into the same area, with pullbacks in between.
A triple top is considered complete, indicating a further price slide, once the price moves below pattern support.
A trader exits longs or enters shorts when the triple top completes.
If trading the pattern, a stop loss can be placed above resistance (peaks).
The estimated downside target for the pattern is the height of the pattern subtracted from the breakout point.


HDFCLIFENSE:HDFCLIFE
This chart was shared on 25th June, and since then breakout is being carried out with full force, it can again be entered with a stop loss of 612 for a target of 621, 626 and if sustains then 630.
**********************************************************************************************************************************************
Hi all,
Its pleasure to have you all here.
I have started putting these charts as a contribution from my side to all people who are new to business, as I had to struggle a lot without any sources at disposal. So please consider this a just small contribution from my side.
Few Honest Disclosures:
1. Any idea shared is my personal view, its not a recommendation, neither any kind of paid propaganda, so please
do your bit of research.
2. Ideas shared does not mean that I trade all or have position in them, this is just a helping hand to all.
3. I expect no comments or like nor any negativity, as I said its just a small helping hand from my side, please plan your risk and trade as per your capacity.
4. To trade in Cash, options or futures is your sole choice and your own risk
5. I am no expert in Tech Indicators, I believe in support resistance and trendline theory, you may use this as a supplement theory for better results.
6. I work for my own living, this is a hobby which I do sincerely to help anyone who might come across my charts.
***********************************************************************************************************************************************

HDFC LIFE INSThis stock has been in an uptrend since the past month, thus, it will be showing some correction. The stock is forming an ascending wedge which is a sign of weakness in the price action. The price has not been able to push past the resistance level i.e. 608-610 level.
The price is going to move towards the 565-570 level. Thus, I would insist no fresh position should be acquired at this point.
According to fibonacci retracement, the price is bouncing up and down in the 23.6% level but further uptrend is highly unlikely. HDFC Life will be bearish for the next 5-6 trading sessions. Acquire fresh positions once the uptrend is confirmed.
Thanks
P


Hdfclife daily chart had formed a Bat pattern#HDFCLife : Hdfclife daily chart had also formed a Bat pattern and currently trading around its prz zone.
This pattern is important because its prz aligned with the important price action resistance at 600 levels.
Watch price action carefully in the zone of 595-616.
At this time, where the market itself is at critical levels, many leading stocks have similar pattern formation.
Take a little challenge and post charts having a bat pattern in place and ask me questions, where are you are finding difficulty in identifying the pattern.
Share it for wider participation


HDFCLifeBreakout for 50Rs.
Red to Green
Price above 200 EMA and 50 EMA
35 to 40 Rs can be kept as target as resitance expected in that level


