Hero MotoCorp downside target 5850 Hero MotoCorp may see a big fall in one to two days, the stock has formed an inverted hammer candle on the daily chart and the stock is currently at its resistance, where there is a possibility of a decline of two to three percent in the next couple of sessions.
HEROMOTOCO trade ideas

hero
**Chart Overview:**
**Stock:** Hero MotoCorp Ltd. (NSE: HEROMOTOCO).
- **Indicators:**
**EMA (Exponential Moving Average)**:
- 9-period EMA: \(5,759.37\)
21-period EMA: \(5,618.91\)
- 50-period EMA: \(5,472.63\)
**200-period SMA (Simple Moving Average):** \(4,788.98\)
**Volumes**: Shown below the price chart, indicating trading activity.
**Highlighted Levels:**
**18th June 2024**: The price touched a resistance level, as indicated by the orange circle. The price struggled to break through that level.
**10th September 2024**: Again, the price tested this resistance level and initially rejected it but managed to make a new attempt to break above in the current phase.
The **horizontal line** shows the resistance level around \(5,860 - 5,961\), which the price is trying to break.
**Analysis of Last Three Candles:**
1. **Candle 1 (Two days ago)**:
**Small Body, Small Wicks**: Indicates a **doji**-like candle, showing indecision in the market as the price consolidates at the resistance level.
**Volume** : Low volume during this session could suggest a lack of strong conviction from buyers or sellers.
2. **Candle 2 (Yesterday)* *:
**Green Candle** : Indicates a bullish move, as the closing price was higher than the opening price.
**Medium Wick on Top* *: Suggests some selling pressure near the end of the session, with buyers unable to close at the day’s high.
**Volume** : Increasing volume compared to the prior session, signaling growing interest from buyers as the stock tries to break resistance.
3. **Candle 3 (Today)**:
**Strong Green Candle** : This is a large bullish candle with little to no wick on top, signaling that buyers were in full control throughout the day, pushing the price significantly higher.
**Volume** : High volume compared to previous days, confirming the bullish momentum and increasing the likelihood of a breakout above the resistance level.
**Conclusion from Last Three Candles:**
The stock has made two attempts (June and September) to break the resistance level around \(5,860 - 5,961\), and the third candle (today) shows a strong breakout attempt with substantial volume. This indicates that the stock might be gaining bullish momentum and could sustain a breakout if buying pressure continues.

Ready for ALL TIME HIGH Again...NSE:HEROMOTOCO trade at 5800 level. Stock trade in Uptrend Channel, and ready for cross its own all time high level, So you can watch for an upside move...


HEROMOTO 15/25 MIN LONGHeromoto is making HH & HL & may break this level & eventually got for next SZ.

WATCHOUT FOR BREAKOUTwait for the breakout to happen ,the last green candle shows wick on top if there is a wick present at the breakout adjust the trend line to match the wick ,many people draw the trend line very closely or without considering the wick and assume the last green candle is the breakout candle but THE BREAKOUT IS YET TO HAPPEN

Hero Motorcorp upside target 5300 - 5400 Hero Motors may see a rise of 2 to 3 percent in the coming week, the stock is currently basing on its strong support, from where there is a possibility of a good rise. At present the stock is in a down trend on the daily chart, it is too early to call it a trend reversal, but a rise of 2 to 3 percent can definitely be seen.

HERO MOTOCORP LTD - Awaiting Bullish Breakout
Strong Uptrend: The stock experienced a strong upward movement in May, establishing a bullish trend.
Descending Channel Formation: Currently, the stock is trading within a descending channel, a pattern that often precedes a breakout.
Awaiting Breakout: A bullish breakout above the channel could lead to a continuation of the uptrend.
Target Level: If the breakout occurs, the next target could be the resistance at ₹5,852.

HeroMotocop-Bullish swing signs NSE:HEROMOTOCO
Buy Above 5608
Target 1- 5850
Target 2-6135
Stop Loss: 5410
Inside candle breakout
Rejection from 0.5 Fibonacci & crossed above 0.382
Rejection from big Fair value gap
Volume are lower during retracement
21 EMA Rejection & above 50 EMA
Happy Trading!!

Hero Motors BullishHero motors formed breakout trade above yesterday high 5625, resistance level 5825 and 6200 and support is 5390.

HeromotocoNSE:HEROMOTOCO
One Can Enter Now !
Or Wait for Retest of the Trendline (BO) !
Or wait For better R:R ratio !
Note :
1.One Can Go long with a Strict SL below the Trendline or Swing Low.
2. R:R ratio should be 1 :2 minimum
3. Plan as per your RISK appetite and Money Management.
Disclaimer : You are responsible for your Profits and loss, Shared for Educational purpose
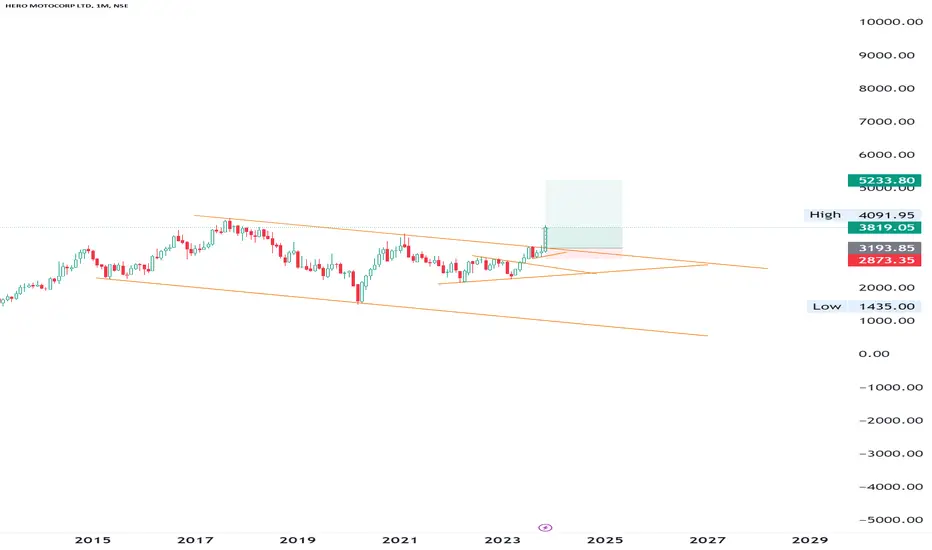
Hero Moto Weds Harley Davidson !!- This is one beautiful price action. One that we see in a textbook.
- 1.7 years of Pure range-bound market - Support and resistance respected.
- A retracement prior to breakout - Weak hands are moved out
- A strong breakout beyond the 3000 mark - The psychological level was no match today.
- Although, A sustenance above it is crucial for the momentum to continue.
- This had a role to play in today's momentum:
www.forbesindia.com
What are your thoughts? Feel free to comment. If it helped, Do Leave us a boost 🚀
Disclaimer: We are not registered advisors. The views expressed here are solely personal opinions. Irrespective of the language used, Nothing mentioned here should be considered as advice or recommendation. Please consult with your financial advisors before making any investment decisions. We like everybody else, have the right to be wrong :)

Hero Motor Elliot Wave AnalysisHero motor daily time period analysis
see chart
Weekly time analysis hero motor
Monthly time chart
The provided chart for Hero MotoCorp (NSE: HEROMOTOCO) is a daily time period chart showcasing Elliott Wave analysis. Here are some key observations:
Elliott Waves: The chart displays an Elliott Wave pattern with labeled waves 1 through 5, indicating a bullish impulse wave.
Support and Resistance: The stock has recently corrected after the 5th wave, potentially indicating a retracement.
Moving Averages: The price is above both the 50-day and 200-day moving averages, suggesting an overall uptrend.
Volume: Volume spikes align with wave 3 and wave 5, typically indicating stronger market participation during these waves.
For further detailed analysis, reviewing specific wave counts and Fibonacci retracement levels could provide more insights.

HEROMOTOCO Long OpportunityWe can go long from current level.This is very strong buying zone of institutional (Big Player).
Trade or Investment at your own risk.
I am not SEBI registered.

#Heromoto 4th time tested 4950, above 4955 fatega kya?Heromoto since Feb'24 4th time has tested the fib resistance of 4954.A day close above 4954 can take this stock towards 1) 510 2)5177 3)5329 4)5473, below 4632 will be exit for me. Since my indicator is also not giving any negative signs, I have high hopes from this setup. Only thing is weakness in overall market can affect it. Lets see

sell at zone ~ intradayexpecting small fall from the zone . look for confirmation inside zone in smaller tf.
- good for intraday trade
- entry inside zone
- sl is day close above zone
- for target draw fib retracement from C to latest swing high , use 0.236 fib as tgt 1 (safe place for intraday), 0.382 as tgt 2 (risk takers).
- don't trade , if u didn't get selling confirmation inside zone
- if day close is above this zone , this pattern becomes invalid.


Hero Motocorp Ltd *Hero Motocorp Ltd*
Rising P&F on Monthly Basis.
Strong Price BreakOut & Sustained.
Strong Vol Consolidation & Continued Traction.
EMAs: Widening Gaps amongst 20/ 50/ 100/ 200 levels.
RSI: 1H<D<W<M. However, all in Bullish Zone.
*Trail SL with Upside*
*Book Profit as per Risk Appetite*
*Do Your Own Research as well. This is an Opinion.*
*_Happy Investing_* 🤓


Time to book profit in Hero Motocorp?
IT may go up from here few more points, but sell siganl at point is a warning for it to have reached current upswing high, so i think we should book profit . What you do youthink?

5th wave play in Hero MotoIf you understand Elliott waves, the chart labelling is self explanatory.
A textbook Elliott wave impulse pattern with missing 5th wave of the 3rd wave.
Thanks for reading, will update as price develops further.
hero moto stock breakout and movingthis is my personal view for short & long term hero moto stock break clearly and now it moving on target levels.their was channel break out like a,b,c formation

hero moto stock breakout and movingthis is my personal view for short & long term hero moto stock break clearly and now it moving on target levels.their was channel break out like a,b,c formation
