Massive Base Formation on Charts – Potential Multibagger LoadingThere are two Chart of HIMATSINGKA SEIDE.
Himatsingka Seide is forming a symmetrical broadening wedge pattern on the weekly timeframe, with a strong support zone near ₹100.
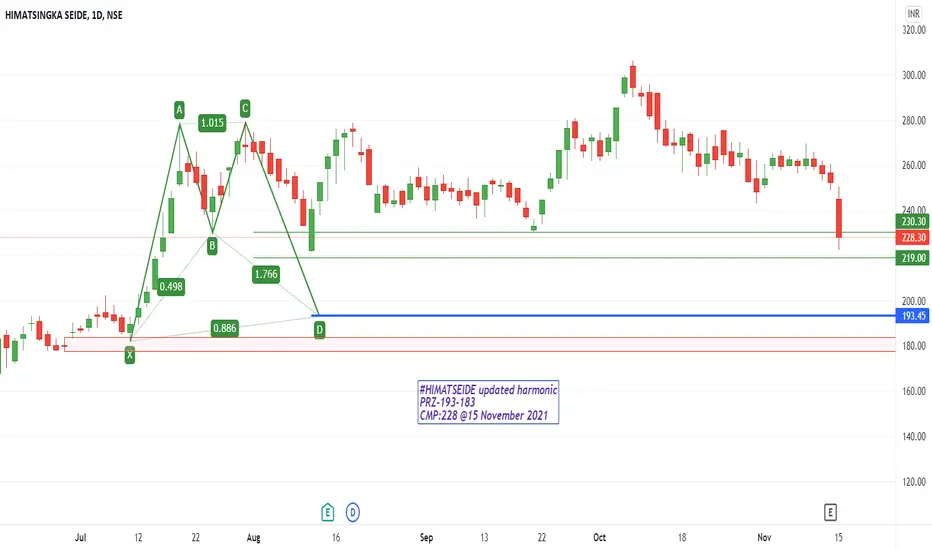
On the daily timeframe, Himatsingka Seide is forming an ascending broadening wedge pattern, with a crucial support level near ₹135.
If this level is Sustain then we may see higher prices in Himatsingka Seide.
Thank You !!
HIMATSEIDE trade ideas

Himatsingka seide 1MHimatsingka Seide is currently trading around ₹140. If the price breaks above the ₹187 level and sustains at that level, there is a strong likelihood of an all-time high breakout.
Disclaimer: The information provided is for educational and informational purposes only and should not be considered as financial advice. Investing in the stock market involves risk, and past performance is not indicative of future results. Please consult with a certified financial advisor or conduct your own research before making any investment decisions. We are not responsible for any losses incurred as a result of using this information. Stock market investments are subject to market risks; read all related documents carefully.

Himatsingka Seide Ltd: Ready for a Turnaround?🚀 Himatsingka Seide Ltd: Ready for a Turnaround? 🚀
Current Market Price: 193
Stop Loss: 175
Targets: 215, 255, 288, 306
Why Himatsingka Seide?
Rounding Bottom Breakout: A technical setup indicating potential for significant upside.
Institutional Confidence: Noticeable increase in FII and DII holdings in the last quarter signals strong interest.
Strategy:
Follow Risk Management: Stick to the stop loss at 175.
Pyramiding Opportunity: Add positions gradually as the stock moves up.
Key Level: Sustained movement above 306 could open doors for a bigger rally.
📈 Outlook: With the right risk management, Himatsingka Seide Ltd could be poised for an exciting turnaround.
📉 Disclaimer: As a non-SEBI registered analyst, I recommend conducting thorough research or seeking advice from financial professionals before making investment decisions.
#HimatsingkaSeide #TurnaroundStock #TechnicalBreakout #InvestmentOpportunities #MarketAnalysis

HIMATSEIDE weekly swing trading analysis Chart Pattern Analysis
• Ascending Triangle Pattern: The chart displays an ascending triangle pattern with a horizontal resistance near ₹180 and an upward-sloping trendline of higher lows. This pattern suggests accumulation with increasing demand at higher levels, indicating the possibility of a bullish breakout.
• Key Resistance Level: ₹180 serves as a significant resistance level. Multiple failed attempts to breach this level highlight its importance as a hurdle for the price.
Volume Analysis
• Volume Confirmation: A pattern of declining volume during consolidation followed by a volume increase near the trendline suggests a buildup phase and potential interest in a breakout. Watching for further volume surges around ₹180 will be critical to validate any breakout.
Price Action and Candlestick Behavior
• Bullish Candlestick Patterns: The presence of bullish candlesticks such as Piercing Line and Hammer formations near the support trendline indicates strong buying demand at lower levels.
• Trendline Support: The ascending trendline support, currently near ₹140-₹150, reinforces the idea that buyers are stepping in at progressively higher levels.
Trading Strategy
1. Breakout Entry: Consider entering a long position if the price closes and sustains above ₹180 with strong volume confirmation.
2. Alternative Entry: For a more conservative approach, traders can consider entries on pullbacks to the ascending trendline near ₹145-₹150 if supported by bullish reversal signals.
3. Stop Loss Placement: A stop loss can be placed below ₹140, slightly beneath the ascending trendline, to manage downside risk. Aggressive traders may opt for a tighter stop below ₹150.
Key Considerations
• Volume Confirmation: Ensure any breakout above ₹180 is supported by a significant volume increase to confirm market conviction.
• Market Sentiment: Broader market sentiment and macroeconomic factors should be considered as they can influence stock movements.
• Risk Management: Adhering to a predefined risk-reward ratio is crucial to managing potential losses.
Disclaimer: This analysis is for informational purposes only and does not constitute financial advice. Trading and investing involve risks, and you should conduct your own research or consult with a professional advisor before making any investment decisions. The author is not responsible for any losses incurred as a result of trading decisions based on this analysis.

HIMATSEIDE:- Will this be next multi bagger in 2025?Company produces home textiles for over 12 global brands, licensed and owned. It owns exclusive license rights of global iconic brands like Calvin Klein, Tommy Hilfiger, Kate Spade, Royal Velvet, Barbara Berry and Waverly.
It also entered into a licensing agreement with The Walt Disney company to manufacture and distribute a broad range of home textile products inspired by archives and characters from all its franchisee including Disney, Marvel, Pixar and Lucas to increase its presence in the European region.
Not a great earnings, but it has a potential to grow.
Lets see.. I am Investing in it any way..!!
Disclaimer
The information and publications are not meant to be, and do not constitute, financial, investment, trading, or other types of advice or recommendations supplied or endorsed by Me.

Lapu Star BreakoutBreakout trading is used by active investors to take a position within a trend's early stages. Generally speaking, this strategy can be the starting point for major price moves, and expansions in volatility and, when managed properly, can offer limited downside risk. Throughout this article, we'll walk you through the anatomy of this trade and offer a few ideas to better manage this trading style.

HIMATSINGKA SEIDE LTD- Rounding bottom with fresh volumesRounding bottom with fresh volumes.
Targets(T1, T2, T3 & T4) mentioned along with expected time frames. Stop loss marked as SL. Can achieve better targets, should carry trailing stop loss once in good gains.
Also keep tracking quarterly results to monitor performance.

HIMATSEIDE cmp 151.Superb setup with tringle pattern breakout,trendline breakout,upper bollinger band crossover.

HIMATSINGKA SEIDE LTDHIMATSINGKA SEIDE LTD
.
BB Blast in Weekly TF
Consolidation from 4 March.
Add more if the gap-up is open and sustained.
Volume is Good.
.
.
CMP -150
SL -137 on CB
.
This is Kartik Thakur,
Signing off
:)

Himatsinka Seide showing HimatChart is self explanatory.
Himatsinka Seide is getting ready.
Looks good. Lets see.
Just an observation, not a recommendation.
Cheers!!

A Cup and Handle pattern Breakout.
In this pattern we can see that there is an breakout, and stock closes above the resistance zone. The main point is that when stock is forming a handle, same curve occur on volume indicator. So this can be a true breakout, and stock may touch to its next resistance. Which could be around 210 and 240. Around 170 it will be a good level to have a stock in portfolio.

HimatsingkaThis stock forming my techno funda pattern in which technicals and fundamentals both are included
Technical (moving average,trend, strength,)
Fundamentals (sales,EPS, PROFIT)more than 20 %
But always remember Stop 🛑 loaa

Himatseide near breakoutHimatsingka Seide is near breakout zone.
Trade if it closes above resistance area.

Consolidation near to resistance As we can see after volume spike near resistance there is consolidation on daily chart one can able to observe .
Above 135 is good
Levels mark
Consider as reversal.

HimatsingkaHimatsingka-
Beautiful setup with a possible golden cross over of 200,50 and 20 Monthly SMAs in the next few days
Safe entry above 125 ..Ultra safe entry above 132

Breakout done this stock.Himmatseide
Breakout stock
Good volume and downtrand Breakout candidate buy this leval and sl 92 and 87 as per your risk reward ratio this is only educational purpose.

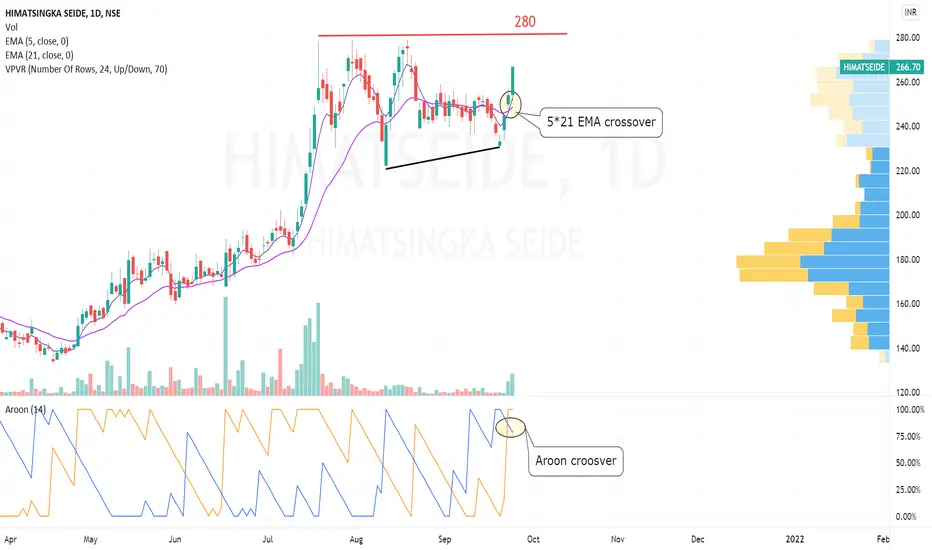
HIMATSIEDE - HIMATSIEDE - Bullish set up.
1. We have 5*21 EMA crossover
2. We have aroon crossover
3. FII are increasing their investments QOQ.
The set up should easily flow into new highs. Safe players should consider an entry only post 280 daily close.

Himatseide - Intraday / Swing Trade Himatseide CMP – 109
Looking bullish and can go for Intraday / Swing trade with the following entry, exit & targets
Buy range 108 - 111 / Stop Loss 107
Target 1 - 115
Target 2 - 120
Target 3 – 125 / 130
Short term target 150 +
Note: This is my view and for educational purpose only

HIMATSEIDEBREAKOUT WITH GREAT VOLUME CAN BE EASILY SPOTTERD BUT THE MAIN THING IS THAT BOTH RS NOW BECOME POSITIVE A BIG RALLY CAN BE SEEN


