Hindalco Short_Near Resistance_Bearish Engulfing candleHindalco Short:
- Price near Resistance
- Bearish Engulfing Pattern
- SL: Today's High
- Target 20 DEMA
- Enter when price is favorable in lower timeframe
HINDALCO trade ideas

Hindalco Industries Ltd view for Intraday 21st May #HINDALCO Hindalco Industries Ltd view for Intraday 21st May #HINDALCO
Resistance 670 Watching above 671 for upside momentum.
Support area 650 Below 660 ignoring upside momentum for intraday
Watching below 649 for downside movement...
Above 660 ignoring downside move for intraday
Charts for Educational purposes only.
Please follow strict stop loss and risk reward if you follow the level.
Thanks,
V Trade Point

Hindalco is giving pullback test.. Hindalco 656 is giving a pullback test. Volume pattern suggests bearishness. Below 640 we find will be bearish to drop down to 522 which could be considered for buying

Bullish on HINDALCOI put up in my earlier post last week that metal counters were looking Bullish and TATA STEEL did it's job.
Now is the turn for HINDALCO. Similar price structure, similar price action. Today morning, there has been a good breakout from congestion zone.
Long position can be built up for a Target of 690 price.
P.S. Not a recommendation. Pls do your own due diligence.

Hindalco AnalysisI have analyzed Hindalco with Trend, candle pattern & Gann techniques. And found that it is looking weak. Stop loss is 716. And Target is 677,659. It is metal stock and due to global pressure it may break.

Hindalco-Bullish Swing- Very good signs of bullish momentum!
Buy above 644.05
Risk reward- 01:01
Target & Stoploss- 4.3%
1.Inside bar breakout found with bullish engulfing after forming 3 green soldiers- Good signs of momentum
2.Price has formed double bottom and hammer before reversal
3.Rejection from 0.318 Fibonacci level
4.Resistance turned to support after breakout with retesting
5.Reacted at support from RSI level
6.Very good fair value gap covered and rejected from FVG
7. 21 EMA cross over for reversal confirmation
8. Previous green candles strength are very good

Hindalco bouncing from SupportHindalco is at its Monthly and Weekly Support.
If it holds can show some theatrics as per Bullish Harmonic Pattern.
Metal Sector seems consolidating.
Do your own diligence.

SWING TRADE OPPORTUNITY - HINDALCOHindalco has taken proper weekly support, which is a nice opportunity to earn a decent profit from this script.
Missed HindalcoHindalco Completing 'W' pattern. This is the beauty of Market. No need to buy now but can see completing the pattern. Target is 676. hopes so it will give breakout after that

HINDALCONSE:HINDALCO
One Can Enter Now ! Or Wait for Retest of the Trendline (BO) Or wait For better R:R ratio
Note :
1.One Can Go long with a Strict SL below the Trendline or Swing Low of Daily Candle.
2. Close, should be good and Clean.
3. R:R ratio should be 1 :2 minimum
4. Plan as per your RISK appetite
Disclaimer : You are responsible for your Profits and loss, Shared for Educational purpose

Go long in HINDALCOThere is a good breakout can been observed in hindalco. From here we can expect targets on 661m 684 and 713 on the upper side.
On the downside there is an important support level of 600. We can place a stoploss for investment (educational purpose).

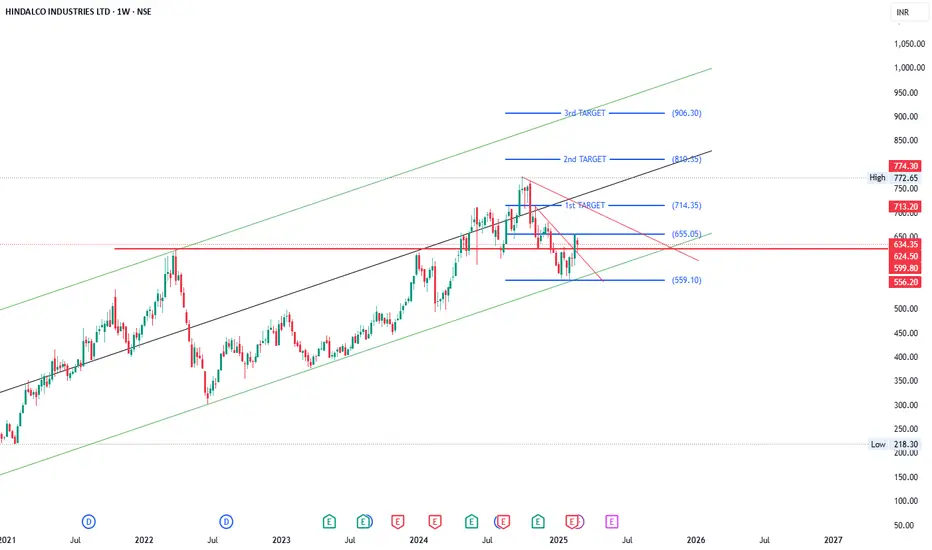
Hindalco Short to Medium term target 900Hindalco forming Cypher pattern. It will have a resistance at 665.
Weekly candle close above 665 will have potential upside with following targets
Target1: 665
Target2: 700 & 725
Tagrte3: 775, 830 & 900
At current state SL: 550
At 665, SL: 640

Hindalco Industries: Breakout from Downward Channel
Analysis:
1. Chart Pattern:
The chart shows Hindalco Industries breaking out of a downward-sloping channel . The breakout is supported by recent bullish candles , indicating strong buying momentum.
2. Key Levels:
Support: ₹595.35 acts as a key support level. The price bounced strongly from this zone.
Resistance:
Immediate resistance at ₹619.30 , where the price is currently testing.
Next resistance at ₹679.80 , aligning with previous swing highs.
3. Volume Analysis:
An increase in volume is visible during the breakout, suggesting participation from buyers and confirming the breakout's strength.
4. Trend Outlook:
The price has shifted from a bearish trend (downward channel) to a potential bullish continuation .
If it sustains above ₹619.30 , the next target could be ₹679.80 . Failure to sustain may lead to a retest of the ₹595.35 level.
5. Indicators:
The moving average (blue line) indicates an uptrend resumption .
Watch for further confirmation with RSI or MACD if available.
Conclusion:
A sustained breakout above ₹619.30 can lead to a bullish rally targeting ₹679.80 .
Traders should monitor price action near key levels and ensure confirmation before entering positions.

Hindalco Positional Trade IdeaHindalco exhibits a strong reversal pattern from the ₹572 demand zone, breaking above ₹615 with a bullish trend continuation.
Key Technical Levels:
Entry: ₹617 (Post breakout confirmation)
Target: ₹650+ (Potential resistance zone)
Stop Loss: ₹597 (Below key support)
Technical Indicators:
RSI showing positive divergence, indicating momentum recovery.
Increasing volume validates the breakout.
Price crossing above TEMA (5, 9, 20) signals trend strength.
Watch for sustained buying pressure to confirm bullish intent!
#Hindalco #TechnicalAnalysis #TradingIdeas"

HINDALCO INDUSTRIES - TECHNICAL VIEW WEEKLY TIME FRAMEHindalco Industries - technical view
HINDALCO, we have a very important support @ 371 levels, chart shared, fall started as expected.

HIndalco Industries 05.01.2025Hindalco Industries looking bearish, Head and shoulder pattern, good to short for target price of 565 in 1 month

HINDALCO LONGHINDALCO
MTF Analysis
HINDALCOYearly Demand 284.0
HINDALCO 6 Month Demand 504.0
HINDALCOQtrly Demand BUFL 620.5
HINDALCOMonthly Demand 567.0
HINDALCOWeekly Demand 550.0
HINDALCODaily Demand DMIP 550.0
ENTRY -1 Long 550.0
SL 516.0
RISK 34.0
Target as per Entry 963.0
Last High 636.0
Last Low 309.0
ENTRY -2 Long 510.0
SL 516.0
RISK -6.0
Target as per Entry 963.0
Last High 636.0
Last Low 309.0

Hindalco (NSE - India) Elliot Wave AnaysisThe Stock has almost completed the 4th Wave correction and preparing for the 5th wave which can be a potential trade.


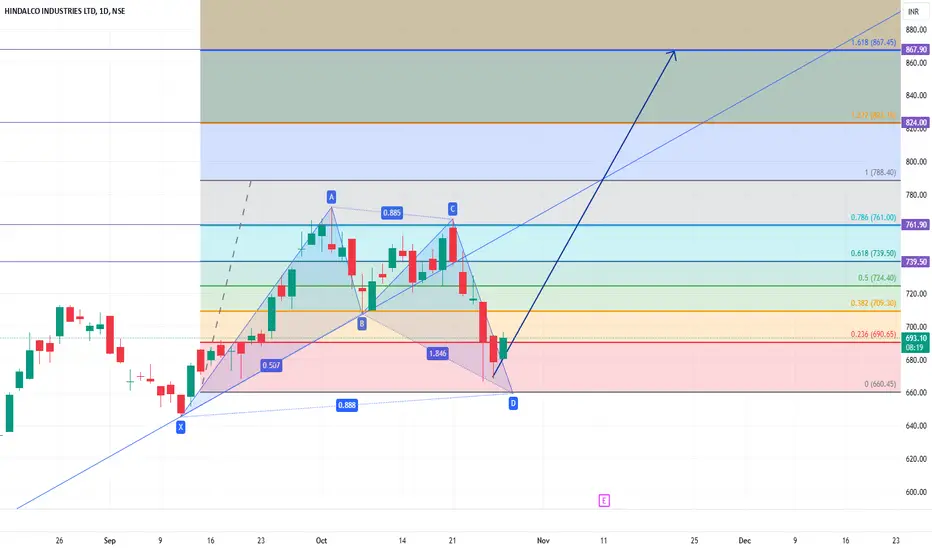
Hindalco - Forming BAT PatternHindalco gas completed BAT pattern formation.
It may take rally up to
Target1: 740 to 760
Target2:823 to 865
Time Frame by beginning of Dec'24
Hindalco - Levels to Enter Hindalco has the potential to go higher, but retracements expected before getting bullish.
Entry 01 - 592
Entry 02 - 550

Hindalco Industries Ltd view for Intraday 25th Nov #HINDALCO Hindalco Industries Ltd view for Intraday 25th Nov #HINDALCO
Resistance 655. Watching above 656 for upside movement...
Support area 645 Below 645 ignoring upside momentum for intraday
Support 645 Watching below 644 for downside movement...
Resistance area 655
Above 655 ignoring downside move for intraday
Charts for Educational purposes only.
Please follow strict stop loss and risk reward if you follow the level.
Thanks,
V Trade Point

Hindalco Industries Ltd view for Intraday 19th Nov #HINDALCO Hindalco Industries Ltd view for Intraday 19th Nov #HINDALCO
Resistance 655. Watching above 656 for upside movement...
Support area 645 Below 645 ignoring upside momentum for intraday
Support 645 Watching below 644 for downside movement...
Resistance area 655
Above 655 ignoring downside move for intraday
Charts for Educational purposes only.
Please follow strict stop loss and risk reward if you follow the level.
Thanks,
V Trade Point
