Hindcopper: C-opper-tunity?Stock looks good, an inverted HnS formation looks complete. Needs a close above 332 in the next session for immediate target of 390, if sustained above 400, it can blast like anything.
HINDCOPPER trade ideas

BREAKOUT !you can get a return of around 20% in this stock ,target is 400 keep an SL @ 308 and enjoy the ride
HAPPY TRADING!

Hindcopper for swingHindustan Copper Ltd, a government-owned corporation, focuses on copper mining and production. The stock is facing slight selling pressure today.
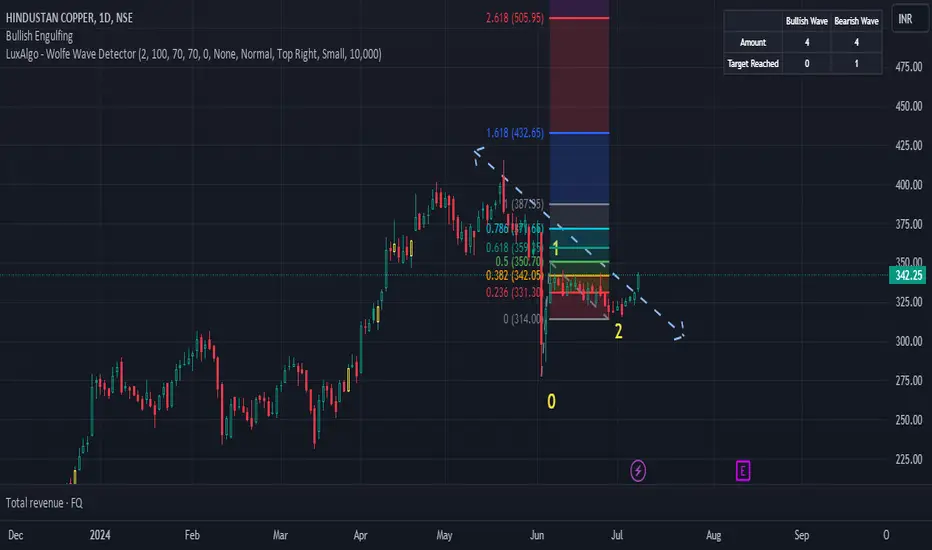
Hind Copper Heading towards 484Currently stock is in 4th wave and going through time correction. If it has already formed a base then based on the Elliot Wave projection the target seems to be 484. Refer to the wave count to get an idea. This view may change slightly if a new low is made below 278 in this correction. I will publish another chart with updated projection if that happens.

Hindcopper If we look at the share price forecast of Hindustan Copper Share Price Target 2025, the 1st Share Price Target is ₹520 and the 2nd Share Price Target is ₹695
Note!!
(no buy or sell recommendations )

Hindcopper If we look at the share price forecast of Hindustan Copper Share Price Target 2025, the 1st Share Price Target is ₹520 and the 2nd Share Price Target is ₹695
Note!!
(no buy or sell recommendations )

HINDCOPPERHi guys,
In this chart i Found a Demand Zone in HINDCOPPER CHART for Positional entry,
Observed these Levels based on price action and Demand & Supply.
*Don't Take any trades based on this Picture.
... because this chart is for educational purpose only not for Buy or Sell Recommendation..
Thank you

Hindustan copper may break all time highHindustan copper can double from here with in a year. Sl below the trend line.
Chart is self explanatory. Please follow the price action & take the trade as per your appetite.
The information provided here is only for educational purpose. The information provided here is not intended to be any kind of financial advice, investment advice, and trading advice. Investment in stock market is very risky and trading stocks, options and other securities involve risk. The risk of loss in stock market can be substantial. Moreover, I am not a SEBI registered analyst, so before taking any decision or before investing in any Share consult your financial advisor and also do your analysis and research.
Request your support and engagement by liking and commenting & follow to provide encouragement.

Hindustan Copper Rally StartedHindustan Copper NSE:HINDCOPPER rally has been started and 1st Traget would be 383 and this can extend upto 428(If you are ready to take risk using GTT).
Hindustan copper in flag and poleHindustan copper is making a good flag on 1 hr time frame. Watchout for breakout for entry.

HINDCOPPER LongNSE:HINDCOPPER1! looking strong at this point with the formation of Cup Handle pattern with justified volume support.
Obviously the SL point is too much but for that I would say this is the price level we can expect in down market.
Disclaimer: This is the idea I am sharing for knowledge purpose for me and others and not for recommendation purpose.

multiyear breackout HCL bullish flag pattern ### Chart Analysis
The chart provided is a monthly candlestick chart for Hindustan Copper (NSE:HINDCOPPER). Here's a detailed breakdown:
1. **Price Movement:**
- **Current Price:** 332.95 INR, down by 6.45%.
- **Historical High:** The chart shows a significant peak around 2012 and another major peak in recent times.
- **Support Levels:** Around 18.25 INR (indicated as demand zones).
- **Resistance Levels:** Around 620.10 INR and 604.90 INR.
2. **Volume:**
- Noticeable volume spikes at points of interest (POI), indicating significant trading activity during those periods.
3. **Technical Indicators:**
- **Moving Averages:** The chart includes moving averages (likely 50-day and 200-day), which show trends and potential crossover points.
- **RSI (Relative Strength Index):** Indicates overbought or oversold conditions. The RSI trendline shows a bullish pattern since 2013.
4. **Pattern Target:**
- A breakout pattern is highlighted with a target of 663.40 INR, which is a potential 108.26% increase from a lower base.
### Trading Plan
**Entry Strategy:**
- **Breakout Confirmation:** Enter a long position if the price breaks above the resistance level around 620 INR with high volume.
- **Pullback:** Consider entering on a pullback to support levels around 300-320 INR, if volume confirms buyer interest.
**Exit Strategy:**
- **Target Price:** Aim for the pattern target of 663.40 INR.
- **Stop Loss:** Set a stop loss below the recent support level, around 260-270 INR, to manage risk.
**Risk Management:**
- **Position Sizing:** Determine the amount to invest based on risk tolerance and the distance to the stop loss.
- **Regular Review:** Continuously monitor the price action, volume, and RSI for any signs of reversal or continuation of the trend.
### Conclusion
This chart suggests potential bullish momentum for Hindustan Copper, particularly if key resistance levels are broken. However, it is crucial to manage risk and confirm breakouts with volume before making any trading decisions.

HINDCOPPER Swing LONGFor educational purposes only
Enter a long position when the price closes above 402. Set the stop loss at 354.9.
This is not a buy/sell recommendation.

HindCopper19/05/2024
Hind Copper
CMP: 388.25
If closed above 402
Target: 10 to 30 %
SL: 3 to 5 % or as per risk
Information is only for study purpose

HINDUSTAN COPPERVery long term (11years) cup & Handle break out in this stock. followed by awesome volume. Break out candle is very big elephant candle. if u want to buy stock buy partial quantity once wait for some retracement, if we get this stock near 200 it will best price to buy.
it has gud potential for upside . Follow strict SL & Proper RISK REWARD RATIO. This is the only holy grail in the market.

Hindustan Copper - Is it Really Copper or is it Gold ???Multi-Timeframe Analysis on Hindustan Copper
Short Term View: Daily
Double Bottom BO done @ Daily timeframe for Target of 350. Just needs to sustain above 290 WCB. On the way, watchout for immediate resistances at 302, 310, 330
Medium Term View: Weekly
Flag Pattern BO confirmed on Weekly timeframe. At the same time, it is facing resistance from previous High of 302. Sustaining above 303 WCB will take the price to 390
Long Term View: Monthly / 3Months
Its an amazing Multi-year Inverted Head & Shoulder pattern BO on Monthly / 3 Months scale. 14 years BO since 2010. Target 615 perfectly intact
Enjoy the Multi-bagger ride of Hindustan Copper....
Disclaimer:
3+ Years Teaching Experience in Stock Market - Technical Analysis, Advanced Patterns, Emotional Management, News based Trading...
We are NOT SEBI Registered and Our focus is NOT providing Buy/Sell Recommendations/calls. Primary Objective is to provide detailed analysis of how to review a chart, explain multi-timeframe views purely for Educational Purposes.
We strongly suggest our followers to "Learn to Ride the Tide irrespective of its Side"
*** Important *** Consult your Financial Advisors before taking any positions
If you like our detailed analysis, please do rate us with your Likes, Boost and share your comments
-Team Stocks-n-Trends

Hindcopper might achive another high based on the chartingLooking good on weekly and monthly chart, Possibility of another high @390, if sustain then ready for up move up to Rs. 407.
There has been significant raise within very short time, so profit booking is expected
Information is only for Educational purpose, no recommendation for Buy or Sell

Multiple breakout failures Stock have good fundamentals
Awesome volume
Taking positions
Sl swing low

MACD Crossover - HINDCOPPER📊 Script: HINDCOPPER
📊 Sector: Non Ferrous Metals
📊 Industry: Mining / Minerals / Metals
Key highlights: 💡⚡
📈 Script is trading near at middle band of BB.
📈 MACD is giving crossover .
📈 Double Moving Averages will give crossover.
📈 Right now RSI is around 59.
📈 One can go for Swing Trade.
⏱️ C.M.P 📑💰- 281
🟢 Target 🎯🏆 - 306
⚠️ Stoploss ☠️🚫 - 269
⚠️ Important: Always maintain your Risk & Reward Ratio.
✅Like and follow to never miss a new idea!✅
Disclaimer: I am not SEBI Registered Advisor. My posts are purely for training and educational purposes.
Eat🍜 Sleep😴 TradingView📈 Repeat 🔁
Happy learning with trading. Cheers!🥂

HINDCOPPER -Hindustan Copper - Buy as Suggested or Wait for DipAs per previous chart history and the company's fundamentals, I suggest buying this stock above 264-265 with a short-term target at 290 - 310-344 and 400 respectively.
I am not SEBI registered person so do your own research before buying this stock as this is my personal opinion about the stock on a technical analysis basis and current chart pattern.
Thanks for your support as always

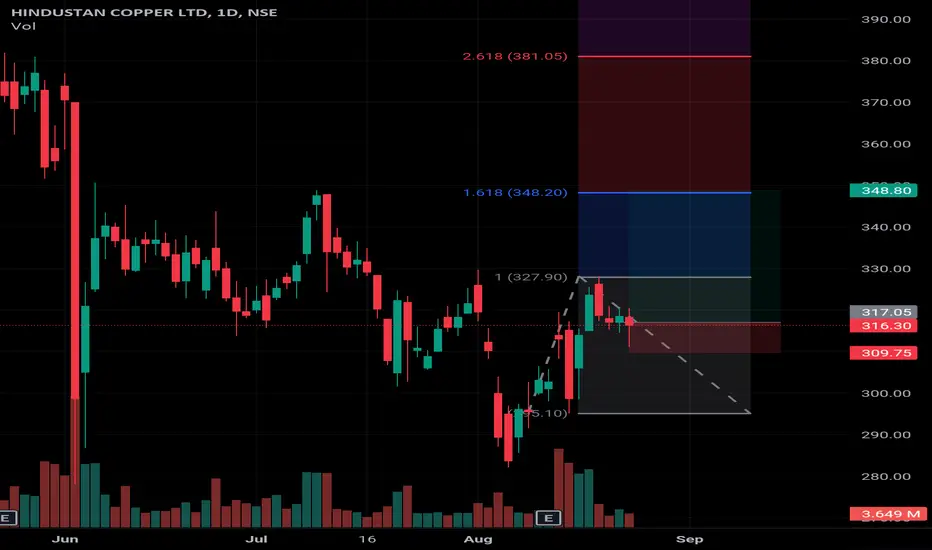
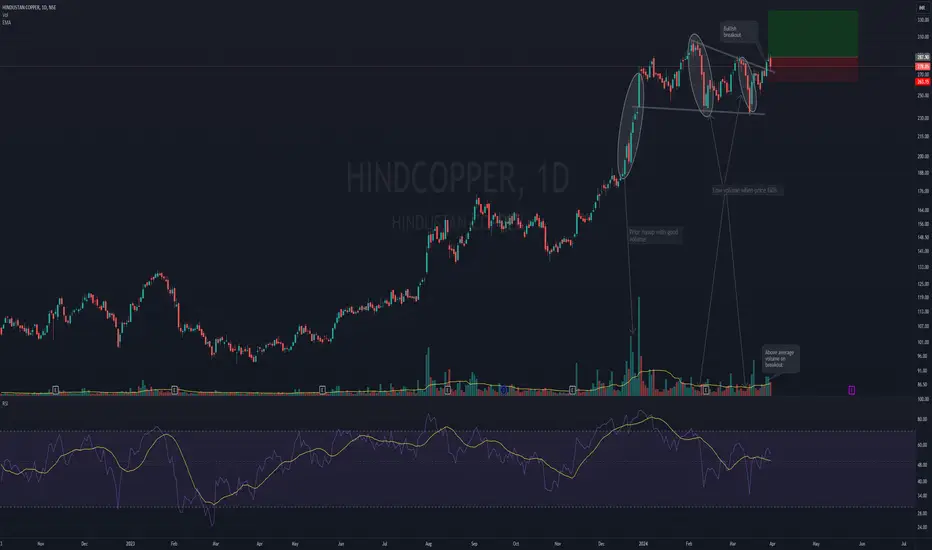
Possible retest on HINDCOPPERHINDCOPPER formed a falling wedge pattern with multiple test of support and resistance. Moreover there was good runup prior to chart pattern formation. Volume were relatively low when price were falling. However upon breakout there was strong volume. Currently resistance is being retested. Good opportunity for long trade with favorable risk reward.
Disclaimer: I am not a SEBI registered consultant. This is not a buying or selling recommendation. Please consult your financial advisor before making any trade. Above information is just my view and is meant for educational purpose only.
HINDCOPPER (Positional)HINDCOPPER (Positional)
-----------------
Range BO & Volume Buildup
Buy @CMP
Short Term Target : 214-227-245-277
Target : 297
SL : 185
Please consult your financial advisor before investing
All research for educational purposes only.

Hind Copper looks Good Hind Copper looks Good, This momentum stock i m sharing for long, holding period around 2-5 week, it can give you 1:2 or 1:3 target around 30 - 40% upside target
