Hindustan Petroleum Corporation LtdHindustan Petroleum Corporation Ltd is mainly engaged in the business of refining of crude oil and marketing of petroleum products, production of hydrocarbons as well as providing services for management of E&P Blocks
Current Price
₹ 446
High / Low
₹ 457 / 288
Stock P/E
14.1
Book Value
₹ 240
Dividend Yield
2.34 %
ROCE
10.5 %
ROE
13.7 %
Face Value
₹ 10.0
Price to book value
1.80
Intrinsic Value
₹ 289
PEG Ratio
0.97
Price to Sales
0.22
Debt
₹ 70,558 Cr.
Debt to equity
1.38
Int Coverage
3.67
HINDPETRO trade ideas

HIND PETROHead and shoulder pattern, no further resistance , sky is clear. It may or may not retest the earlier resistance now its a support, fingers crossed

highest ever weekly close : breakout on chartsHPCL witnessed its highest ever weekly frame close with a clean clear breakout
volumes are healthy with stock clocked more than 11% jump last week.
rsi witnessed healthy improvement and suggest the momentum to continue

Review and plan for 7th May 2025 Nifty future and banknifty future analysis and intraday plan.
Quarterly results.
This video is for information/education purpose only. you are 100% responsible for any actions you take by reading/viewing this post.
please consult your financial advisor before taking any action.
----Vinaykumar hiremath, CMT

#HINDUSTAN PETROLEUMA Demand Zone for Hindustan Petroleum (HPCL) refers to a specific price level on the stock's chart where buying pressure has historically been strong, causing the price to reverse or bounce upward. These zones are identified by areas where the price consolidated before making a sharp upward move, indicating a concentration of buying interest.
In the context of HPCL, a demand zone could represent a level where institutional or retail investors are likely to step in and buy the stock, either due to perceived value, support levels, or other technical factors. Traders often use these zones to identify potential entry points for long positions, anticipating a price reversal or continuation of an upward trend.

Hindustan Petroleum: Long Positional Trade IdeaHindustan Petroleum (HPCL) is trading at ₹419, showing strength on the daily chart with bullish momentum.
Key Observations:
Support Levels: Immediate support lies near ₹400, with a stronger base around ₹380.
Resistance Levels: A breakout above ₹420-425 could lead to a rally towards ₹450-460, with a longer-term target of ₹480.
Indicators:
RSI is trending near 64, indicating bullish sentiment but not yet overbought.
The stock is trading above its TEMA levels, reinforcing upward momentum.
Strategy:
Entry: Above ₹425 for a confirmed breakout.
Targets: ₹450 (short term), ₹480+ (positional).
Stop-Loss: Below ₹395 to limit risk.
Watch for volume confirmation on the breakout!

HindPetro LongHind Petro is showing STP, and also a good momentum shown at the Resistance Line. So there is a possibility of 10% up move..

#HINDPETRO Weekly TFHindPetro ....a breakout above the trend line will give a target of 475 . Also this trend line breakout will be a breakout of falling wedge pattern in uptrend momentum
Time Frame Taken : Weekly ... so entry should be on weekly closing ....on DAILy TF three white soldiers also confirmed ....followed by a dragonfly Doji in the making as of today
Disclaimer : Trade on Your own Risk . This is not a buy sell recommendation ....Just for education Purpose

HINDUSTAN PETROLEUM CORPHello,
Trend-Based Analysis. Buy the Dips, Sell The Rallies, Also Following the Trend. Let's see where the Price Action takes us, Riding the wave. Potential trade setups based on trend momentum.
Technical analysis based on trend identification and momentum, Looking for high-probability setups within the prevailing trend.
Analyzing the current market trend and potential future price movement. Focusing on risk management and reward-to-risk ratios.
Details is Mentioned in Chart, Read carefully.. .

HPCL S/RSupport and Resistance Levels:
Support Levels: These are price points (green line/shade) where a downward trend may be halted due to a concentration of buying interest. Imagine them as a safety net where buyers step in, preventing further decline.
Resistance Levels: Conversely, resistance levels (red line/shade) are where upward trends might stall due to increased selling interest. They act like a ceiling where sellers come in to push prices down.
Breakouts:
Bullish Breakout: When the price moves above resistance, it often indicates strong buying interest and the potential for a continued uptrend. Traders may view this as a signal to buy or hold.
Bearish Breakout: When the price falls below support, it can signal strong selling interest and the potential for a continued downtrend. Traders might see this as a cue to sell or avoid buying.
20 EMA (Exponential Moving Average):
Above 20 EMA(50 EMA): If the stock price is above the 20 EMA, it suggests a potential uptrend or bullish momentum.
Below 20 EMA: If the stock price is below the 20 EMA, it indicates a potential downtrend or bearish momentum.
Trendline: A trendline is a straight line drawn on a chart to represent the general direction of a data point set.
Uptrend Line: Drawn by connecting the lows in an upward trend. Indicates that the price is moving higher over time. Acts as a support level, where prices tend to bounce upward.
Downtrend Line: Drawn by connecting the highs in a downward trend. Indicates that the price is moving lower over time. It acts as a resistance level, where prices tend to drop.
RSI: RSI readings greater than the 70 level are overbought territory, and RSI readings lower than the 30 level are considered oversold territory.
Combining RSI with Support and Resistance:
Support Level: This is a price level where a stock tends to find buying interest, preventing it from falling further. If RSI is showing an oversold condition (below 30) and the price is near or at a strong support level, it could be a good buy signal.
Resistance Level: This is a price level where a stock tends to find selling interest, preventing it from rising further. If RSI is showing an overbought condition (above 70) and the price is near or at a strong resistance level, it could be a signal to sell or short the asset.
Disclaimer:
I am not a SEBI registered. The information provided here is for learning purposes only and should not be interpreted as financial advice. Consider the broader market context and consult with a qualified financial advisor before making investment decisions.

HINDPETROHi guys,
In this chart i Found a Demand Zone in HINDPETRO CHART for Positional entry,
Observed these Levels based on price action and Demand & Supply.
*Don't Take any trades based on this Picture.
... because this chart is for educational purpose only not for Buy or Sell Recommendation..
Thank you

High Dividend yield HPCL wants to fly higher. Hindustan Petroleum Corp. Ltd. engages in the business of refining crude oil and sales of petroleum products. It operates through the Downstream and Others segment. The Downstream segment deals with the refining and marketing of petroleum products; The Other segment engages in exploration and production of hydrocarbons, manufacturing sugar ethanol. Hindustan Petroleum Corp. CMP is 405.85.
The positive aspects of the company are cheap Valuation (P.E. = 8.7), Company with Zero Promoter Pledge, Annual Profit Growth higher than Sector Profit Growth, MFs increased their shareholding last quarter and Stocks Outperforming their Industry Price Change in the Quarter. Dividend yield of the company at CMP is 5.2%. The Negative aspects of the company are Increasing Trend in Non-Core Income.
Entry can be taken after closing above 409 Targets in the stock will be 416 and 429. The long-term target in the stock will be 447 and 457. Stop loss in the stock should be maintained at Closing below 380 or 363 depending on your risk taking ability.
Disclaimer:The above information is provided for educational purpose, analysis and paper trading only. Please don't treat this as a buy or sell recommendation for the stock. We do not guarantee any success in highly volatile market or otherwise. Stock market investment is subject to market risks which include global and regional risks. We will not be responsible for any Profit or loss that may occur due to any financial decision taken based on any data provided in this message.


HPCL- Bullish swing- Towards creating new ATH ?!
24.09.2024
Buy- Above 419
NSE:HINDPETRO Target-448.5
Stop Loss-391
Risk Reward- 1:1
1.Breakout- Inside bar breakout
2.Upward trend with continues HH & HL formation
3.Price reversed from Resistance converted to support level(Very strong level)
4.Good volumes increase
5. Price rejection from 50 EMA and 21 EMA
6. Very good rejection from Fair value gap
7. Price reacted from 0.382 Fibonacci

50 SMA Rising - Positional TradeDisclaimer: I am not a Sebi registered adviser.
This Idea is publish purely for educational purpose only before investing in any stocks please take advise from your financial adviser.
Its 50 SMA Rising Strategy. Suitable for Positional Trading Initial Stop loss lowest of last 2 candles and keep trailing with 50 days SMA if price close below 50 SMA then Exit or be in the trade some time trade can go for several months.
Be Discipline because discipline is the Key to Success in the STOCK Market.
Trade What you see not what you Think

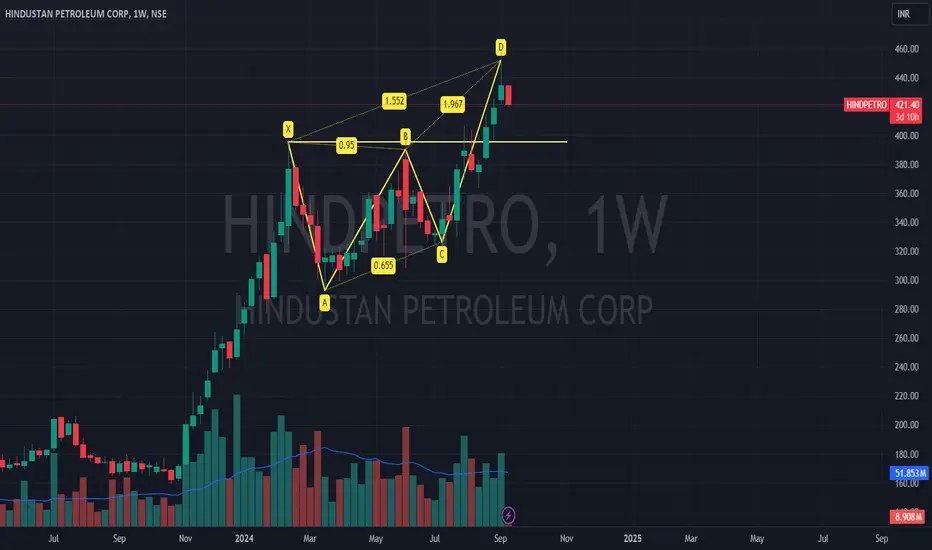
HPCL 1WHPCL's Weekly Chart: A Technical Perspective
If HPCL's price action aligns with the classic bearish butterfly pattern, it could suggest that the stock's upward momentum is weakening. This might lead to a price decline of approximately 100 rupees from the current level of 421. However, it's important to note that technical analysis is not foolproof, and other factors, such as fundamental analysis and market sentiment, can influence the stock's price.
I Am Not SEBI Registered Analyst. All Post and Levels Posting is only for educational and knowledge purpose. I Am not responsible for your any kind of loss or profit.
No Claim, All Rights Reserved.‼️
HINDPETRO potential breakout - 6 months long base.
- Consolidation in a narrow range outside base.
- Near 52 week high.
- Low risk entry with a tight stoploss.
- Strong sector.
- High relative strength.
- Potential start of a new uptrend.

hindpetro breakout is done and focus on this stock.hindpetro is ready for upper side this stock is buying but proper with sl.
buying..403-406
sl....379
target...490

Hindpetro intraday level for 22nd Aug #HINDPETRO Hindpetro intraday level for 22nd Aug #HINDPETRO
Buying may witness above 410
Support area 403. Below ignoring buying momentum for intraday
Selling may witness below 403
Resistance area 410
Above ignoring selling momentum for intraday
Charts for Educational purposes only.
Please follow strict stop loss and risk reward if you follow the level.
Thanks,
V Trade Point

Swing Trade - HINDPETRO📊 Script: HINDPETRO
📊 Sector: Refineries
📊 Industry: Refineries
Key highlights: 💡⚡
📈 Script is trading at upper band of BB.
📈 MACD is giving crossover .
📈 Double Moving Averages are giving crossover.
📈 Right now RSI is around 68.
📈 One can go for Swing Trade.
⏱️ C.M.P 📑💰- 407
🟢 Target 🎯🏆 - 432
⚠️ Stoploss ☠️🚫 - 393
⚠️ Important: Always maintain your Risk & Reward Ratio.
✅Like and follow to never miss a new idea!✅
Disclaimer: I am not SEBI Registered Advisor. My posts are purely for training and educational purposes.
Eat🍜 Sleep😴 TradingView📈 Repeat 🔁
Happy learning with trading. Cheers!🥂

HPCL down side target 360HPCL will see further decline, the stock is facing a big resistance on the weekly chart, in the coming time the stock can go to the level of 360 or even below.

Hindustan Petroleum Corporation LimitedNext Big move on Hindustan Petroleum Corporation Limited
For Longs as price is at the Fib Golden zone, Rejected at order block with fair value gap, Wait for the trend line brake with volume. take a lower time frame long entry to increase risk to reward ratio..
