3 months holdingHINDPETRO made inverse head & shoulder pattern on WEEKLY charts with above average volume.
Could b bought in cash & hold for 2-3 months for target of 540.
Note: These are future levels,adjust it in cash levels.

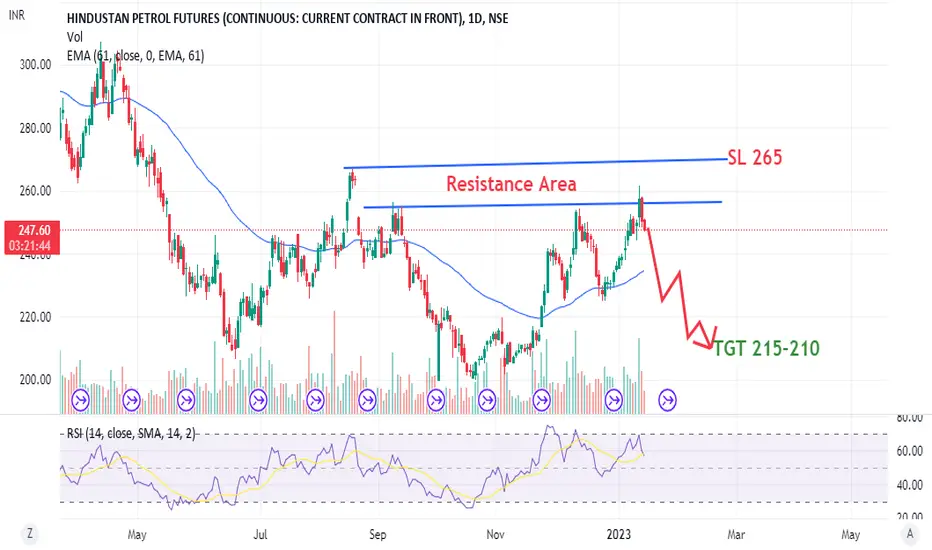
Future Trade: Bearish pattern seen in HPCLHPCL is reversing from almost triple top and RSI showing continuous negative divergence and is expected to turn bearish as seen on the daily time frame charts. A bearish engulfing candle pattern formation, having the open and high almost the same can be seen. Futures data also show a short buildup.
HINDPETRO1!29-11
Daily chart of HINDPETRO1!
LTP: 238.85
The long term trends (manual and 200 EMA) are bearish.
RSI is overbought and signals a bearish reversal.
Supports are at 241.50 (200 EMA) and 237.05 (manual)
Strong support zone is between 200 and 207 so it may not be broken.
I think we will witness a p

HINDPETRO1!27-11
daily chart of Hind Petro
manual trendline and 200 EMA are bearish
RSI heading towards the overbought zone
Resistance at 237 (manual) and 241 (200 EMA)
Wait for RSI to get in the overbought zone & or price to come up to 238 / 240 and go short

See all ideas
Summarizing what the indicators are suggesting.
Neutral
SellBuy
Strong sellStrong buy
Strong sellSellNeutralBuyStrong buy
Neutral
SellBuy
Strong sellStrong buy
Strong sellSellNeutralBuyStrong buy
Neutral
SellBuy
Strong sellStrong buy
Strong sellSellNeutralBuyStrong buy
A representation of what an asset is worth today and what the market thinks it will be worth in the future.
Frequently Asked Questions
The current price of HINDUSTAN PETROL FUTURES is 422.60 INR — it has fallen −2.87% in the past 24 hours. Watch HINDUSTAN PETROL FUTURES price in more detail on the chart.
The volume of HINDUSTAN PETROL FUTURES is 5.21 M. Track more important stats on the HINDUSTAN PETROL FUTURES chart.
The nearest expiration date for HINDUSTAN PETROL FUTURES is Jul 31, 2025.
Traders prefer to sell futures contracts when they've already made money on the investment, but still have plenty of time left before the expiration date. Thus, many consider it a good option to sell HINDUSTAN PETROL FUTURES before Jul 31, 2025.
Open interest is the number of contracts held by traders in active positions — they're not closed or expired. For HINDUSTAN PETROL FUTURES this number is 51.20 M. You can use it to track a prevailing market trend and adjust your own strategy: declining open interest for HINDUSTAN PETROL FUTURES shows that traders are closing their positions, which means a weakening trend.
Buying or selling futures contracts depends on many factors: season, underlying commodity, your own trading strategy. So mostly it's up to you, but if you look for some certain calculations to take into account, you can study technical analysis for HINDUSTAN PETROL FUTURES. Today its technical rating is sell, but remember that market conditions change all the time, so it's always crucial to do your own research. See more of HINDUSTAN PETROL FUTURES technicals for a more comprehensive analysis.