HINDUNILVR trade ideas


hindustan uniliversince tomorrow on 21st July its result is coming and fmcg sector is doing super well in lockdown and predicted its result will also be good and will break resistance and tgt as per chart

Hindustan Unilever Daily Chart FIB SupportHUL has been a very stable stock during the COVID crisis. With the broad market showing signs of weakness and HUL being at good support levels, it might just give a reasonable return at a favourable risk-reward.

HUL ;GO LONG TGT 2500AFTER PROPER CORRECTION ,IT HAS MADE A CUP AND HANDLE PATTERN;AND GIVEN A DAY BREAK OUT
1ST TFT 2500


ANATOMY OF HINDUSTAN UNIIF BREAK THESE LEVELS ...THEN TARGET IS NEXT LINE ...ITS ALO A S&R LEVELS ...
TREND SCRIPT ...

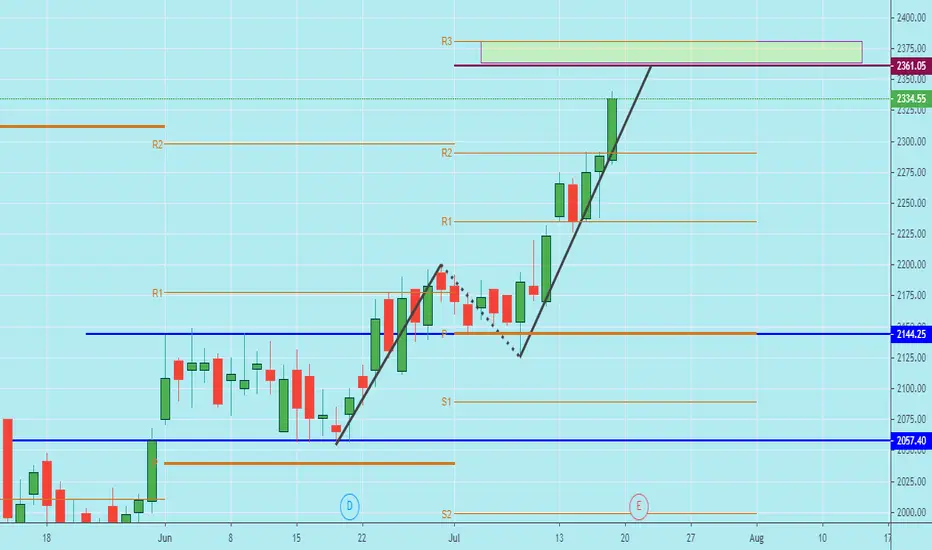
Simple & Effective Breakout Trade #NiftySimple things and analysis make money in this market rather than filling your screens with patterns and indicators, A clear breakout is is visible in HUL after few trading sessions in 4 Hour chart , its clear coming out of its range now and heading towards creating new higher highs.

Hindustan Unilever (HUL) - Bull Flag & Supply Zone BreakoutNSE:HINDUNILVR gave a breakout from supply zone as well as bull flag.

Go Long if it break above the resistance levelbuy above 2145
Please do your own analysis before initiating the trade.


HINDUNILVR - GO SHORT FOR A GREAT RR BY 17 JULYHINDUNILVR - GO SHORT @ 2218 WITH A SL OF 2287 AND A TARGET OF 1950. TARGET SHOULD BE ACHIEVED BY 17 JULY 2020

Hindustan Unilever from 4 July 2020The stock was moving in sideways channel --> it broke with very much difficulty
It is now showing signs of spring entry ...
Multiple red candle touched the breakout level and now a jump in price is seen ... possibly showed retest of resitance zone ...
Main trade setup can be expected ...
1. Buying ITM CE --> why ITM because if price decrease we don't want to lose to time decay .
2. Selling OTM PE --> this OTM PE can be sell .. price on safe side can be should be below Support Zone (green)

HUL ABOUT BIG MOVEHUL MAKING TRIANGLE PATTERN.AGGRESSIVE BUYERS CAN TAKE ENTRY ABOVE MIDDLE LINE WITH SL OF BREAKOUT BAR'S PREVIOUS BAR'S LOW FOR TARGET OF NEXT BLUE PRICE RANGE BOX.30 MINUTE CHART,WITH MACD CONFIRMATION.IF YOU LIKE MY IDEA PLZ SHARE AND LIKE WITH YOUR BESTIES.

HINDUNILVR making rising wedge pattern on daily charts !HINDUNILVR is about to touch the triangle. Great long idea at 2110-2120 for target of 2200+


