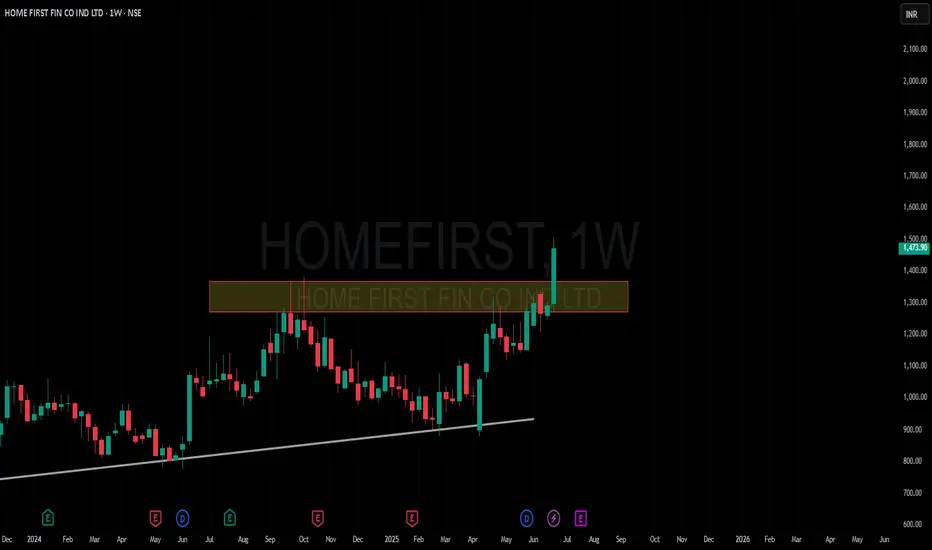
Amazing breakout on WEEKLY Timeframe - HOMEFIRSTCheckout an amazing breakout happened in the stock in Weekly timeframe, macroscopically seen in Daily timeframe. Having a great favor that the stock might be bullish expecting a staggering returns of minimum 25% TGT. IMPORTANT BREAKOUT LEVELS ARE ALWAYS RESPECTED!
NOTE for learners: Place the breakout levels as per the chart shared and track it yourself to get amazed!!
#No complicated chart patterns
#No big big indicators
#No Excel sheet or number magics
TRADE IDEA: WAIT FOR THE STOCK TO BREAKOUT IN WEEKLY TIMEFRAME ABOVE THIS LEVEL.
Checkout an amazing breakout happened in the stock in Weekly timeframe.
Breakouts happening in longer timeframe is way more powerful than the breakouts seen in Daily timeframe. You can blindly invest once the weekly candle closes above the breakout line and stay invested forever. Also these stocks breakouts are lifelong predictions, it means technically these breakouts happen giving more returns in the longer runs. Hence, even when the scrip makes a loss of 10% / 20% / 30% / 50%, the stock will regain and turn around. Once they again enter the same breakout level, they will flyyyyyyyyyyyy like a ROCKET if held in the portfolio in the longer run.
Time makes money, GREEDY & EGO will not make money.
Also, magically these breakouts tend to prove that the companies turn around and fundamentally becoming strong. Also the magic happens when more diversification is done in various sectors under various scripts with equal money invested in each N500 scripts.
The real deal is when to purchase and where to purchase the stock. That is where Breakout study comes into play.
Check this stock which has made an all time low and high chances that it makes a "V" shaped recovery.
> Taking support at last years support or breakout level
> High chances that it reverses from this point.
> Volume dried up badly in last few months / days.
> Very high suspicion based analysis and not based on chart patterns / candle patterns deeply.
> VALUABLE STOCK AVAILABLE AT A DISCOUNTED PRICE
> OPPURTUNITY TO ACCUMULATE ADEQUATE QUANTITY
> MARKET AFTER A CORRECTION / PANIC FALL TO MAKE GOOD INVESTMENT
DISCLAIMER : This is just for educational purpose. This type of analysis is equivalent to catching a falling knife. If you are a warrior, you throw all the knives back else you will be sorrow if it hits SL. Make sure to do your analysis well. This type of analysis only suits high risks investor and whose is willing to throw all the knives above irrespective of any sectoral rotation. BE VERY CAUTIOUS AS IT IS EXTREME BOTTOM FISHING.
HOWEVER, THIS IS HOW MULTIBAGGERS ARE CAUGHT !
STOCK IS AT RIGHT PE / RIGHT EVALUATION / MORE ROAD TO GROW / CORRECTED IV / EXCELLENT BOOKS / USING MARKET CRASH AS AN OPPURTUNITY / EPS AT SKY.
LET'S PUMP IN SOME MONEY AND REVOLUTIONIZE THE NATION'S ECONOMY!
HOMEFIRST trade ideas
HOMEFIRST Proper Cup and Handle in place. Finance and Banking Stocks are all the buzz right now, this should be on your radar for a long trade.

HOMEFIRST : Capitalizing on Demand Rejection for Long-term GainsHome First Finance Ltd.
Current Price: ₹1,058.55
Chart Observations:
The stock shows a corrective pattern marked as (A-B-C). The final wave C has hit a deep retracement zone (₹925–₹868) , which corresponds to 113%–127% Fibonacci levels.
A Wave C completion zone aligns with a strong demand area. This creates a second buy zone , with the stock expected to reverse upward toward its higher Fibonacci targets.
Break of a minor swing high structure around ₹1,100 confirms the bullish trajectory.
Buying Levels:
First buy zone: ₹1,030–₹1,060 (current price levels).
Second buy zone: ₹925–₹868 (Wave C retracement zone).
Stop Loss:
For Zone 1 Entry: ₹869.
For Zone 2 Entry: ₹820 (safe placement below retracement zone).
Target:
First Target: ₹1,318
Second Target: ₹1,492
Pro Tip to Avoid SL Hunting: Wait for rejection wicks or a bullish engulfing pattern within the demand zone for higher probability entries.
Disclaimer: This analysis is for educational purposes only . Investments in stocks and financial markets involve risks, including the loss of principal. Always conduct your own due diligence or consult with a certified financial advisor before making any investment decisions.

HOME FIRST - Best case!The chart is self-explanatory as always :)
⚠️Disclaimer: We are not registered advisors. The views expressed here are merely personal opinions. Irrespective of the language used, Nothing mentioned here should be considered as advice or recommendation. Please consult with your financial advisors before making any investment decisions. Like everybody else, we too can be wrong at times ✌🏻

Home first financegood breakout with vol. buy at cmp sl-875 tgt-1050. may give good upside because recently govt announced construction of 3crore more houses under pmay scheme

SWING IDEA - HOMEFIRST FINANCE COHome First Finance Company (HFFC) , a leading player in the housing finance sector, is flashing signals of a potential swing trade opportunity.
Reasons are listed below :
The stock has repeatedly tested the 860-880 range, breaking through it recently. It's now revisiting this range, suggesting a potential support-turned-resistance dynamic, a classic setup for swing trading.
On the daily timeframe, a bullish engulfing candle has formed, indicating a strong shift towards bullish sentiment. This pattern often signals a potential reversal or continuation of an upward trend.
The 200-day Exponential Moving Average (EMA) is acting as a support level on the daily chart, further bolstering the case for a bullish bias.
The stock is finding support around the 0.5 Fibonacci retracement level, adding another layer of technical support to the bullish thesis.
Home First Finance has been establishing a pattern of constant higher highs, indicating sustained upward momentum and a potential continuation of the current uptrend.
Target - 960 // 1060
StopLoss - daily close below 860
DISCLAIMER -
Decisions to buy, sell, hold or trade in securities, commodities and other investments involve risk and are best made based on the advice of qualified financial professionals. Any trading in securities or other investments involves a risk of substantial losses. The practice of "Day Trading" involves particularly high risks and can cause you to lose substantial sums of money. Before undertaking any trading program, you should consult a qualified financial professional. Please consider carefully whether such trading is suitable for you in light of your financial condition and ability to bear financial risks. Under no circumstances shall we be liable for any loss or damage you or anyone else incurs as a result of any trading or investment activity that you or anyone else engages in based on any information or material you receive through TradingView or our services.
@visionary.growth.insights

Multiple Confluences, Should Think about This. Confluence is the combination of multiple strategies and ideas into one complete strategy. Confluence occurs when two or more separate ideas or strategies are used together to form a comprehensive investment strategy that is in line with an investor's risk profile and goals.
Confluence 1- It Looks Double Bottom in Support Zone.
Confluence 2- Candlestick Confirmation
Tweezer Bottom-A tweezer is a technical analysis pattern, commonly involving two candlesticks, that can signify either a market top or bottom. Tweezer bottoms are considered to be short-term bullish reversal patterns,
So stop is very less and Trade is looking Pretty good.
which should be below 580 WCB.
All the best.
Gratify if you appreciate the practice then you can like it, share it and
If you want me to investigate any chart for you then would cherish doing that for you.
Thank you for your time and support.
Stay safe.

Mad bull is coming...Company is strong in every aspects....... exponential growth starts........still in rest. Ready for skyway...... let's 🙊

💥HomeFirstFinance💥-Nice Breakout💥HomeFirstFinance💥-Nice Breakout
Capital to be deployed- 20k
Investing Price -945-955
Breakout Price -943
Stoploss-802
Targets-1185-1621
RT for max reach
#homefirst #StocksToBuy #stocks #StocksToTrade #StocksInFocus #stockstowatch #StocksInNews #SwingTrading #BREAKOUTSTOCKS

HOMEFIRST Positional Upside IdeaNSE:HOMEFIRST is trading and sustained above major resistance of 700. My idea is to take entry at the level of 710 with stop loss of 690.
My upside target will be 734 & 765, This could be low risk and high reward option.
Note: This is my personal analysis, only for learning. Thanks.

Homefirst Looking Bukllish Above 1167Homefirst Looking Bukllish Above 1167 will touch 1190-1230-1300 in coming days

#HomefirstA good management company. I am already in. The numbers are good and NPA is negligible.
Small ticket size housing loans for salaried class.
HOMEFIRST - BULLISH HARMONIC PATTERN - HOURLYBullish Harmonic Pattern Established, possible targets mentioned in the chart
Disclaimer - This is not a buy or sell advice. I am sharing what I see on the chat & what I am trading, based on my own knowledge & understanding. Please consult your financial advisor before taking any bets in the stock market. I will not be responsible for any profit/loss you incur on your trades based on my published ideas

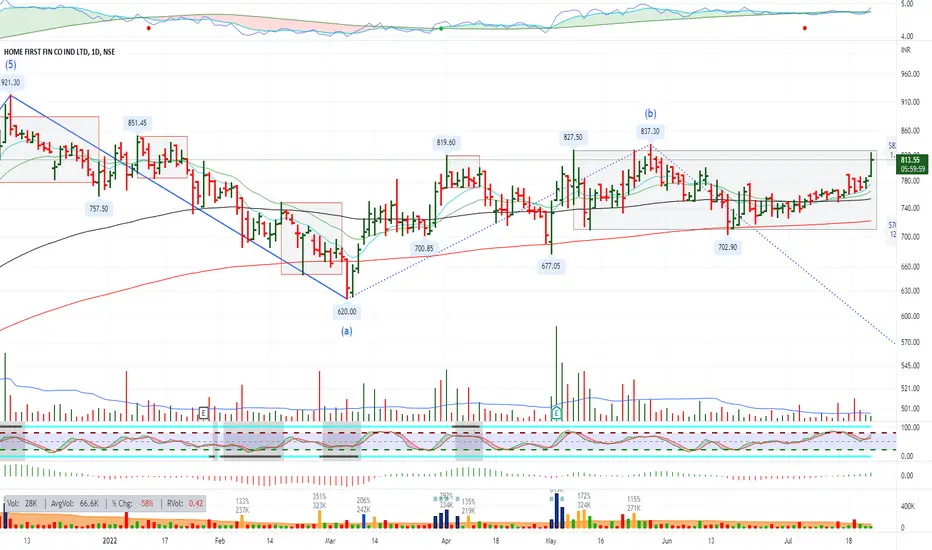
Home First Fin Co Ind Ltd - Medium to long term investment buyOn Analyzing the weekly chart of Home First Fin Ind Ltd, we noticed a symmetrical triangle formation in the weekly chart. Smart recoveries can be seen in this stock and can reach its all time high in short term. Given the stock chart structure is very good anyone looking for an investment for 6 months and above can add this stock in his portfolio
if
Stock closes above 778 tomorrow (27-05-2022)
**Ideas are my own** Invest as per your risk-taking ability***

Home Finance Finance India Sun Storm Investment Trading Desk & NexGen Wealth Management Service Present's: SSITD & NexGen Portfolio of the Week Series
Focus: Worldwide
By Sun Storm Investment Research & NexGen Wealth Management Service
A Profit & Solutions Strategy & Research
Trading | Investment | Stocks | ETF | Mutual Funds | Crypto | Bonds | Options | Dividend | Futures |
USA | Canada | UK | Germany | France | Italy | Rest of Europe | Mexico | India
Disclaimer: Sun Storm Investment and NexGen are not registered financial advisors, so please do your own research before trading & investing anything. This is information is for only research purposes not for actual trading & investing decision.
#debadipb #profitsolutions

HOMEFIRST NSE BULLISH VIEW ABOVE 640HOMEFIRST NSE is bullish if it holds above 640. Near its all-time HIGH.
** For Educational Purposes Only
NSE:HOMEFIRST

Breakout in homefirst fin corporationSwing trade as well as intraday
Buy above 615 stoploss 680
Target 640/700

HOMEFIRST INTRADAY !!! for 18.08.2021SYMMETRICAL TRIANGLE FORMED ON 30 MIN CHART!!
IF gave breakout down side can give you a good short side!!
if breaks up side then can make a good intraday profit !!
200 EMA giving a good support at breaking side can retrace back and move down !!
target 2-3%
stop loss opening candle high!!
(only for study purpose do not take it as any buy or sell call)


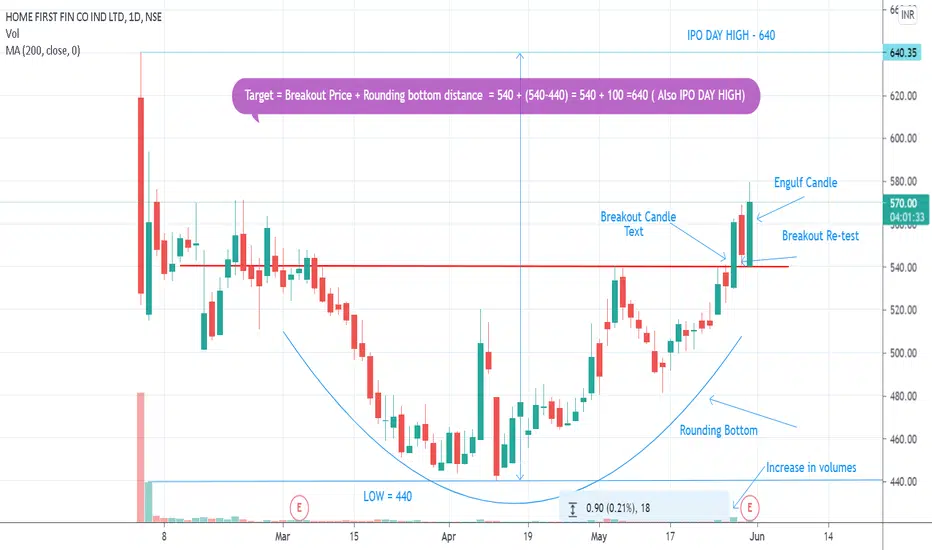
LONG ON HOME FIRST - TARGET 640Good breakout and re-test done. Good volume after rounding bottom breakout. Target should be Breakout level + (Distance Traveled for rounding bottom formation ) = 540 + 100 = 640 which is also IPO day High.
SL should be kept just below 540 DCB.
HOME FIRST FIN CO IND LTD 1HRHOME FIRST FIN CO IND LTD gave a good listing gains then it corrected 30% giving a downside moment in a trendline after the breakout it gave upside of 14% and came again for retest then upside moment of 10% then it started consolidating in cup and handle pattern currently it is ready to give a breakout upside when the handle of the cup breaks with a good volume and can go long. Buy after green line and sell at red lines. Better for upside.
Time frame 15,30min.

Good stock for long term. 505 level is the best to buy. If below it. It would be down.. But above it it will be blast.. For long term you can go with this. Short term 505 to 648.
