HYUNDAI - Swing Trade#HYUNDAI #swingtrade #trendingstock #momentumtrading #breakoutstock
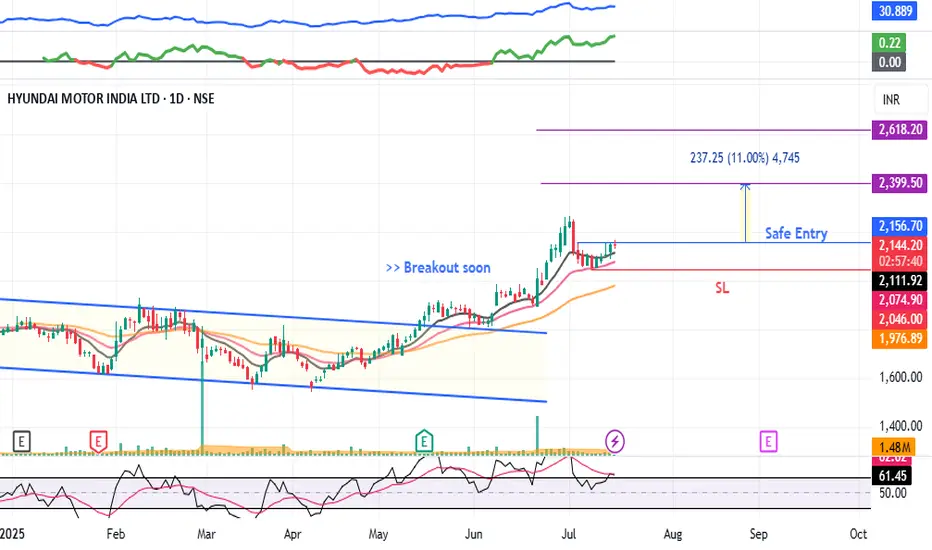
HYUNDAI : Swing Trade
>> Breakout soon
>> Trending Stock
>> Volume Dried up
>> Good strength
>> Low Risk Trade ( RR - 1:2 or 1:3 )
Swing Traders can lock profit at 10% and keep trailing
Pls Boost, like and comment if u like the analysis
Disc: Charts shared are for Learning purpose, Take position only after consulting ur Financial Advisor or a SEBI Registered Advisor
HYUNDAI trade ideas
HYUNDAIHYUNDAI
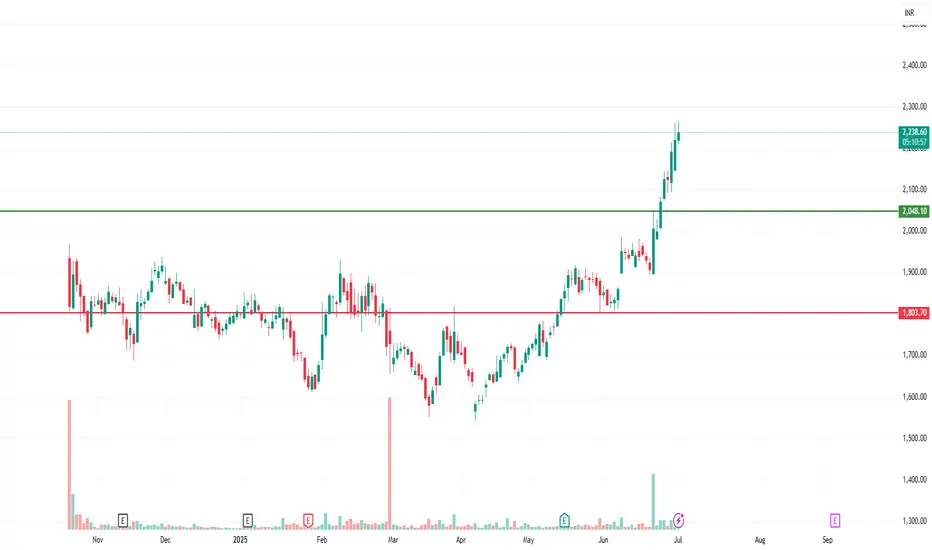
watch above levels. green line is our entry, redline is our SL.
DISCLAIMER : I am NOT a SEBI registered advisor or a financial adviser. All the views are for educational purpose only.
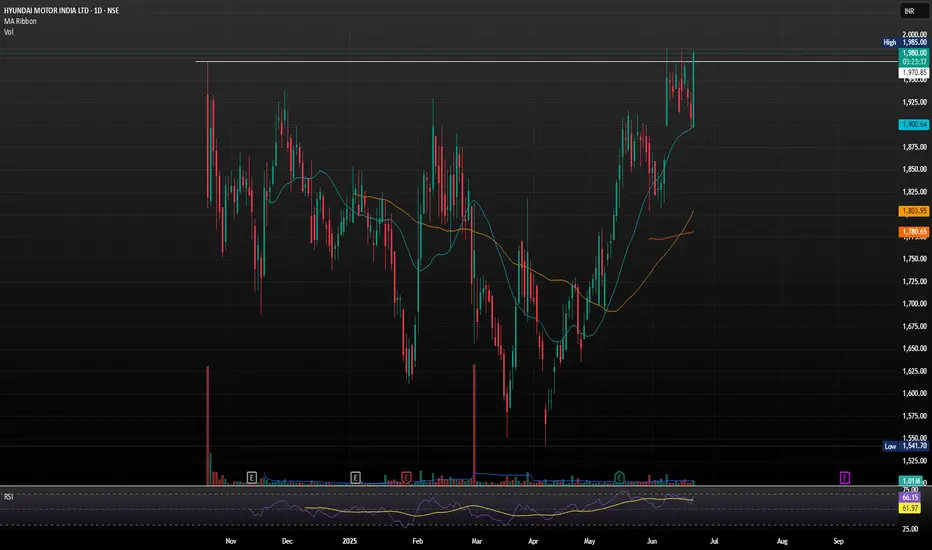
HYUNDAI - Moving above IPO priceAuto's are trying to make a come back and Hyundai is looking to lead it from the front. All time high was made recently. Ideal entry should be on a pullback

HYUNDAI MOTORS LTD BREACHING ATHHyundai Motor India is one of the leading car manufacturers in the country, known for its wide range of vehicles—from hatchbacks and sedans to SUVs and electric cars. Some of its most popular models include the Creta, Venue, Verna, and the all-electric Ioniq 5.
If Hyundai Motor India has broken past the 2000 mark it may setting their sights even higher. UBS has issued the most bullish call so far, with a target of 2350, citing strong capacity expansion, export momentum, and premium product positioning. Other projections suggest a broader range between 2291 and 2328, depending on market conditions and quarterly performance.
Hyundai Motor India Ltd view for Intraday 19th May #HYUNDAI Hyundai Motor India Ltd view for Intraday 19th May #HYUNDAI
Resistance 1870 Watching above 1876 for upside momentum.
Support area 1840 Below 1860 ignoring upside momentum for intraday
Watching below 1835 for downside movement...
Above 1860 ignoring downside move for intraday
Charts for Educational purposes only.
Please follow strict stop loss and risk reward if you follow the level.
Thanks,
V Trade Point

HYUNDAIDisclaimer:
This is not financial advice. Please do your own research or consult with a financial advisor before making any investment decisions. Investments in stocks can be risky and may result in loss of capital.

Hyundai Motors Set to Fall After Disappointing Quarterly ResultsHyundai Motor India reported a 19% year-on-year (YoY) decline in its consolidated net profit for the December quarter. The profit stood at Rs 1,161 crore, compared to Rs 1,425 crore during the same period last year. This decline was attributed to lower domestic sales and exports.
As the stock has been recently listed, there isn't much historical data available for technical analysis. However, it has broken the previous closing low of Rs 1,635, which suggests that we can expect further declines, potentially leading to weaker results.

HYUNDAI MOTOR INDIA LTD S/RSupport and Resistance Levels:
Support Levels: These are price points (green line/shade) where a downward trend may be halted due to a concentration of buying interest. Imagine them as a safety net where buyers step in, preventing further decline.
Resistance Levels: Conversely, resistance levels (red line/shade) are where upward trends might stall due to increased selling interest. They act like a ceiling where sellers come in to push prices down.
Breakouts:
Bullish Breakout: When the price moves above resistance, it often indicates strong buying interest and the potential for a continued uptrend. Traders may view this as a signal to buy or hold.
Bearish Breakout: When the price falls below support, it can signal strong selling interest and the potential for a continued downtrend. Traders might see this as a cue to sell or avoid buying.
20 EMA (Exponential Moving Average):
Above 20 EMA(50 EMA): If the stock price is above the 20 EMA, it suggests a potential uptrend or bullish momentum.
Below 20 EMA: If the stock price is below the 20 EMA, it indicates a potential downtrend or bearish momentum.
Trendline: A trendline is a straight line drawn on a chart to represent the general direction of a data point set.
Uptrend Line: Drawn by connecting the lows in an upward trend. Indicates that the price is moving higher over time. Acts as a support level, where prices tend to bounce upward.
Downtrend Line: Drawn by connecting the highs in a downward trend. Indicates that the price is moving lower over time. It acts as a resistance level, where prices tend to drop.
RSI: RSI readings greater than the 70 level are overbought territory, and RSI readings lower than the 30 level are considered oversold territory.
Combining RSI with Support and Resistance:
Support Level: This is a price level where a stock tends to find buying interest, preventing it from falling further. If RSI is showing an oversold condition (below 30) and the price is near or at a strong support level, it could be a good buy signal.
Resistance Level: This is a price level where a stock tends to find selling interest, preventing it from rising further. If RSI is showing an overbought condition (above 70) and the price is near or at a strong resistance level, it could be a signal to sell or short the asset.
Disclaimer:
I am not a SEBI registered. The information provided here is for learning purposes only and should not be interpreted as financial advice. Consider the broader market context and consult with a qualified financial advisor before making investment decisions.

Hyundai India Stock AnalysisTechnical Analysis of Hyundai India (1-Hour Timeframe)
1. Falling Wedge Pattern
The chart displays a falling wedge pattern, which is a bullish reversal setup. After a prolonged downward movement, the price has broken out of the wedge, indicating a potential upward trend.
The breakout is supported by higher volume, which validates the strength of the move.
2. Breakout and Target
The breakout from the wedge suggests an initial target around ₹1,900, based on the height of the wedge projected from the breakout point.
If momentum sustains, a further move towards higher resistance levels can be expected.
3. Support and Resistance Levels
Immediate Support: ₹1,800, which aligns with the wedge breakout zone.
Key Resistance Levels:
₹1,860: Minor resistance zone before the projected target.
₹1,900: Target zone based on the wedge projection.
4. Volume Analysis
The breakout candle shows increased volume, suggesting strong buying interest. Continuation of this trend would confirm sustained upward momentum.
5. Moving Averages
The price is trading above short-term moving averages, indicating a bullish trend. These averages could act as dynamic support during retracements.
Fundamental Analysis
1. Company Overview
Hyundai Motor India is a key player in the Indian automotive market, known for its wide range of vehicles and innovative technologies.
It has a strong focus on electric vehicles (EVs), making it well-positioned in a rapidly evolving market.
2. Revenue Growth
Hyundai India has seen consistent revenue growth, supported by strong domestic demand and an increasing share of exports.
Its leadership in the SUV segment and focus on EVs have been driving sales.
3. Market Position
The company is one of the leading automakers in India, with a strong brand presence and an extensive dealer network.
It continues to invest in expanding its EV lineup, targeting the growing demand for green vehicles.
4. Challenges
Competitive pressures in the Indian auto market, especially from Tata Motors in the EV space.
Dependence on supply chain stability for semiconductor components, which could impact production schedules.
5. Sector Outlook
The Indian automotive sector is poised for growth, driven by rising disposable incomes, infrastructure development, and the transition to EVs. Hyundai's strategic positioning in both ICE and EV markets provides a competitive edge.
Conclusion:
Technical Outlook:
The breakout from the falling wedge suggests bullish momentum with targets at ₹1,860 and ₹1,900.
Immediate support lies at ₹1,800, and volume is confirming the breakout strength.
Fundamental Outlook:
Hyundai India has strong fundamentals with consistent revenue growth, leadership in key segments, and a focus on future-ready EVs.
The company is well-positioned to capitalize on India's automotive growth story.

HYUNDAI MOTORS INDIA LTD S/RSupport and Resistance Levels:
Support Levels: These are price points (green line/shade) where a downward trend may be halted due to a concentration of buying interest. Imagine them as a safety net where buyers step in, preventing further decline.
Resistance Levels: Conversely, resistance levels (red line/shade) are where upward trends might stall due to increased selling interest. They act like a ceiling where sellers come in to push prices down.
Breakouts:
Bullish Breakout: When the price moves above resistance, it often indicates strong buying interest and the potential for a continued uptrend. Traders may view this as a signal to buy or hold.
Bearish Breakout: When the price falls below support, it can signal strong selling interest and the potential for a continued downtrend. Traders might see this as a cue to sell or avoid buying.
20 EMA (Exponential Moving Average):
Above 20 EMA(50 EMA): If the stock price is above the 20 EMA, it suggests a potential uptrend or bullish momentum.
Below 20 EMA: If the stock price is below the 20 EMA, it indicates a potential downtrend or bearish momentum.
Trendline: A trendline is a straight line drawn on a chart to represent the general direction of a data point set.
Uptrend Line: Drawn by connecting the lows in an upward trend. Indicates that the price is moving higher over time. Acts as a support level, where prices tend to bounce upward.
Downtrend Line: Drawn by connecting the highs in a downward trend. Indicates that the price is moving lower over time. It acts as a resistance level, where prices tend to drop.
RSI: RSI readings greater than the 70 level are overbought territory, and RSI readings lower than the 30 level are considered oversold territory.
Combining RSI with Support and Resistance:
Support Level: This is a price level where a stock tends to find buying interest, preventing it from falling further. If RSI is showing an oversold condition (below 30) and the price is near or at a strong support level, it could be a good buy signal.
Resistance Level: This is a price level where a stock tends to find selling interest, preventing it from rising further. If RSI is showing an overbought condition (above 70) and the price is near or at a strong resistance level, it could be a signal to sell or short the asset.
Disclaimer:
I am not a SEBI registered. The information provided here is for learning purposes only and should not be interpreted as financial advice. Consider the broader market context and consult with a qualified financial advisor before making investment decisions.
