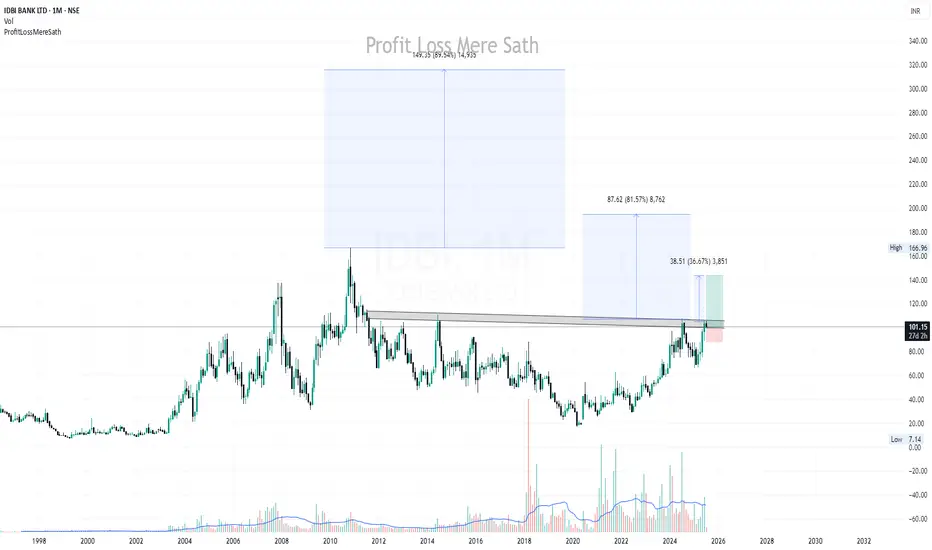
IDBI BANK LTD - for Long-Term🚀 Breakout Alert!
IDBI Bank has finally broken out of a multi-year resistance zone that was acting as a strong supply area since 2010. The breakout is supported by significant volume, indicating strong institutional participation.
🟩 Structure Highlights:
Price has broken above the long-term horizontal resistance trendline (marked in grey).
Monthly candle shows solid strength despite some profit booking from ₹105 levels.
Volume spike suggests buyer confidence.
📈 Potential Upside Targets:
Target 1: ₹140 (≈36.67%)
Target 2: ₹185 (≈81.57%)
Target 3: ₹250+ (≈149.35%) in the longer term, replicating past breakout moves.
📉 Support Zone: ₹88–95 (former resistance turned support). Any retest around this zone can offer good risk-reward entry.
📌 Conclusion:
This breakout marks the end of a decade-long consolidation. As long as the price holds above ₹88 on a monthly closing basis, the uptrend looks intact. Ideal for positional swing traders and long-term investors watching for multi-bagger potential.
IDBI trade ideas
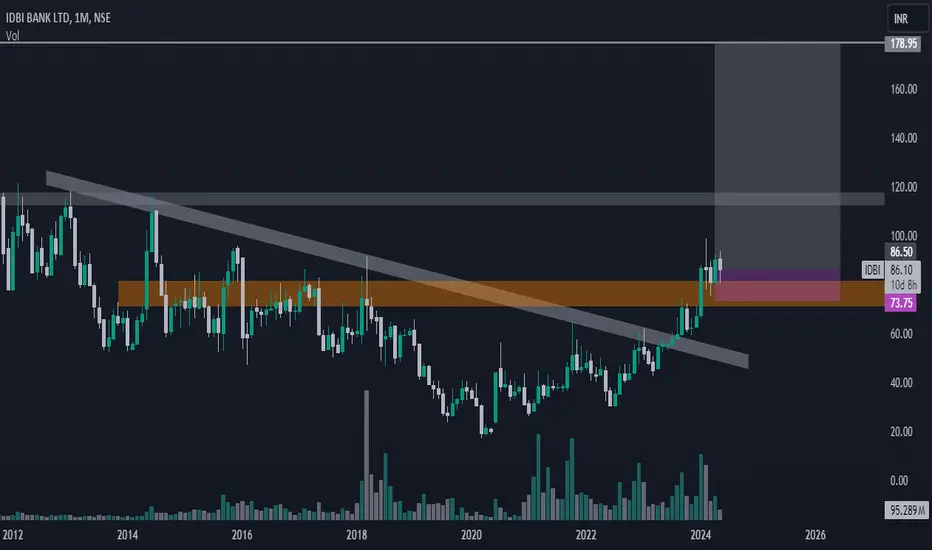
IDBI : Red band Resistance on a monthly time frame IDBI : Red band Resistance on a monthly time
frame.
There is a Buy triggered on a daily time frame at 100 but on a monthly time frame there is a major Red Band Resistance.
On a 3 Month frame also it is almost sitting just above and around Red band Resistance.
To continue the rally these Red Band resistances needs to be cleared off for IDBI.
( Not a Buy / Sell Recommendation
Do your own due diligence ,Market is subject to risks, This is my own view and for learning only .)

Positional Setup: IDBI Bank Ltd (NSE)Chart Pattern: Cup and Handle Formation
CMP: ₹101.33
Technical Structure: Classic bullish Cup & Handle breakout setup in progress
Volume: Noticeable rise in volumes at breakout zones
Momentum: RSI & moving averages support the trend continuation
📊 Technical Levels (Positional Setup)
Support Zones: ₹95 / ₹90
Breakout Zone: ₹101–104 (once cleared, confirms the breakout)
Targets Post Breakout:
🎯 T1: ₹115
🎯 T2: ₹125
🎯 T3: ₹135
Stop Loss: Below ₹90 (closing basis)

IDBI Bank : Buy triggered but sitting right at a Red band ResisIDBI Bank : Buy triggered but sitting right at a Red band Resistance .
Last time it has turned back from 104 and 107
( Not a Buy / Sell Recommendation
Do your own due diligence ,Market is subject to risks, This is my own view and for learning only .)

IDBI- Analysis Only for long term investors
As you can see stock has made top in November 2010 and from March 2020 it has given close to 400% returns, can this trend continue for next 1-2 years or more?
It will be a good to keep buying this stock on every retracements. Good buying range will be around 83 to 98 , if it come around 76 that will be even better price for averaging.
Stoploss of day closing below 70 for consecutive 2-3 days or as per your comfort or risk management.
Targets can be 117 to 121 ,129 to 133 then 173 to 167 and may be 208 to 212
**Disclaimer -
I am not a SEBI registered analyst or advisor. I does not represent or endorse the accuracy or reliability of any information, conversation, or content. Stock trading is inherently risky and the users agree to assume complete and full responsibility for the outcomes of all trading decisions that they make, including but not limited to loss of capital. None of these communications should be construed as an offer to buy or sell securities, nor advice to do so. The users understands and acknowledges that there is a very high risk involved in trading securities. By using this information, the user agrees that use of this information is entirely at their own risk.
Thank you.

IDBI Bank LTDIn this analysis, we are focusing on Price Action and using pullback trading as our method of trading.
Based on our trading methodology, the price has recently pulled back into the demand zone in the monthly chart, with a target of 105. The weekly chart has been in an uptrend, but recently has signaled a trend reversal. However, as a monthly zone is considered stronger than the weekly chart, we can expect the weekly chart to continue its uptrend and move towards a target of 105.
I am not SEBI registered. The information provided here is for learning purposes only and should not be interpreted as financial advice. Consider the broader market context and consult with a qualified financial advisor before making investment decisions.

IDBI Bank Looking to make a comeback on Weekly Charts. IDBI Bank Ltd. engages in the provision of commercial banking services to retail and corporate customers. It operates through the following segments: Corporate and Wholesale Banking; Retail Banking; Treasury; and Other Banking and Group Operations. The Corporate and Wholesale Banking segment includes corporate relationship covering deposit and credit activities other than retail, as well as corporate advisory and syndication, project appraisal, and investment portfolio.
IDBI Bank Ltd. Closing price is 79.49. The positive aspects of the company are Attractive Valuation (P.E. = 11.9), Companies with Zero Promoter Pledge, Company able to generate Net Cash - Improving Net Cash Flow, Companies with Low Debt, Stocks Outperforming their Industry Price Change in the Quarter, FII / FPI or Institutions increasing their shareholding and MFs increased their shareholding last quarter The Negative aspects of the company is Companies with high market cap, lower public shareholding.
Entry can be taken after closing above 80 Historical Resistance in the stock will be 83.7, 88.1 and 92.1. PEAK Historic Resistance in the stock will be 95.6 and 99.3. Stop loss in the stock should be maintained at Closing below 65.4.
Disclaimer: The above information is provided for educational purpose, analysis and paper trading only. Please don't treat this as a buy or sell recommendation for the stock or index. The Techno-Funda analysis is based on data that is more than 3 months old. Supports and Resistances are determined by historic past peaks and Valley in the chart. Many other indicators and patterns like EMA, RSI, MACD, Volumes, Fibonacci, parallel channel etc. use historic data which is 3 months or older cyclical points. There is no guarantee they will work in future as markets are highly volatile and swings in prices are also due to macro and micro factors based on actions taken by the company as well as region and global events. Equity investment is subject to risks. I or my clients or family members might have positions in the stocks that we mention in our educational posts. We will not be responsible for any Profit or loss that may occur due to any financial decision taken based on any data provided in this message. Do consult your investment advisor before taking any financial decisions. Stop losses should be an important part of any investment in equity.

IDBI BANK SWING TRADE📊 Price Action & Trend Analysis
Analyzing market trends using price action, key support/resistance levels, and candlestick patterns to identify high-probability trade setups.
Always follow the trend and manage risk wisely!
Price Action Analysis Interprets Market Movements Using Patterns And Trends On Price Charts.
👉👉👉Follow us for Live Market Views/Trades/Analysis/News Updates.

Reading a chart is not a very difficult art. Today we will try to understand how to read the charts how to make assumptions based on the same. First thing that one must understand that it is not a rocket science. One has to be creative, attentive and a sort of meditative. Albert Einstein once said that "it is not that I am smart but I stay with the questions much longer".
For reading the chart one must ask questions to the chart and observe the answers by reading between the lines and understanding the patterns. Everything has patterns. Even time is not linear even as per Vedas the time is cyclical. That's why we have God (Generator, Operator and Destroyer). If time is cyclical the cycle is a pattern. We say that history repeats itself.
Stock market legend Jesse Livermore once said "All through time, people have basically acted and reacted the same way in the market as a result of greed, fear, ignorance, and hope. That is why the numerical formations and patterns recur on a constant basis. Patterns repeat because human nature hasn’t changed for thousands of years” If you want to know more about Jesse Live more you can watch the movies like The American Clock, The day the bubble burst or The bucket Boy.
Thus by asking the question to the chart and by observing the chart and searching fo the answers by noticing the patterns, historic layouts, supports, resistances and applying certain amount of basic maths and common sense one can come to know about the risk is to reward ratio in buying a stock or a derivative.
'Breakout' or Breakout level is what we are searching for. The coveted breakout may happen or it may not even after calculations and chart study and fundamental analysis. So if break out fails you must have a stop loss to protect your capital. If breakout actually happens you let your money work and reap the benefit. After having understood this basic concept let us try to analyse the chart of IDBI Bank for the purpose of education. I will mention below my observations of the same. The purpose of this analysis is educational and one must not treat it as a buy or sell call.
The First thing that I observe here is that the stock is moving in a particular parallel channel. Many of the stocks do move in channels. There are different kind of channels and this one is a parallel channel. In a parallel channel channel top works as a resistance, Channel bottom works as a support and mid channel might work as a support if stock price is above it. The same mid channel will work as a resistance if the stock price is below it. Thus we get a Long term target 120 which can be the channel top. We get a long term support 75 which can be the channel bottom. The point to note is that 75 level has been supporting this stock since March 24. The stock has bounced from there many a times as indicated in the chart. In this particular case mid channel will work like a resistance. The real breakout might happen after we get a closing above it at the levels of 91.6.
CMP of the stock is 85.12 but before we reach 91.6. There is a scope of trend line breakout if the stock closes above 87.6. Thus 91.6 is my first target. The closing above 91.6 can also be treated as a compounding point for stock's further journey. You can also think of takin partial entries at 87.6 and 91.6. If I am a Short term trader, I can even trade the stock for the target of 91.6. After closing above 91.6 further targets can be 96, 99, 101, 105, 107 and finally 120. Partial profit booking can also be done at these various levels. Trailing stop loss can also be increased step by step as the stock moves northwards.
You can never be overconfident in your analysis. Stock market is a graveyard of lot of over confident people. The design of stock market is such that it transfers money from the impatient to the patient. Thus you need a stop loss in case your break out fails. In this particular case I can keep my stop loss at either at a closing below 83 as there are Mother and Father lines (50 and 200 days EMA) at this point. To know more about stuff like parallel channel, Mother Father and Small child theory and much more interesting ways to make your money work through Techno-Funda investing. You can read my book The Happy Candles Way to wealth creation. The book is available on Amazon in (Paperback) and Kindle version (E-Version). The book has potential to become your handbook or an investment guide.
If I am little bit more risk taking person I will keep the stop loss at closing below 75 in this case as 75 has historically provided a great support to the stock. Additionally now it has also become more powerful by becoming a channel bottom support (Importance of channel bottom support is discussed earlier in the article). A person who looks at the risk reward ratio can see that down side risk is Rs.2 or Rs.10 considering my risk taking ability and upside potential is around Rs 35. If you consider 120 as a channel top. So incase I keep my stop loss at 75 and my long term target at 120 my risk reward ratio can be 1:3.5. In case if I keep my target at 99 and my stop loss at 83 my risk reward ratio is 1:7 or so. So the risk reward ratio is a dynamic number which will keep changing depending on your target and risk taking ability. You need to calculate it personally. There can not be a universal risk reward ratio. As different people will keep different targets and different stop losses. Once you have determined your target and stop loss adhere to it strictly. In case of stop loss you have to be particularly strict. In case of target you can let the stock fly even higher than your target but you have to adhere to a trailing stop loss strictly. My book about which I have a description earlier talks at depth about stop loss and trailing stop loss.
I sincerely hope that this write-up will help you in reading the charts, understanding the importance of charts and becoming a better investor.
Disclaimer: The above information is provided for educational purpose, analysis and paper trading only. Please don't treat this as a buy or sell recommendation for the stock. We do not guarantee any success in highly volatile market or otherwise. Stock market investment is subject to market risks which include global and regional risks. We will not be responsible for any Profit or loss that may occur due to any financial decision taken based on any data provided in this message.

IDBI DAILY CHART TIME FRAME - MY VIEW ONLYThe Structure looks good to us, waiting for this instrument to correct and then give us these opportunities as shown on this instrument (Price Chart).
Note: Its my view only and its for educational purpose only. Only who has got knowledge about this strategy, will understand what to be done on this setup. its purely based on my technical analysis only (strategies). we don't focus on the short term moves, we look for only for Bullish or Bearish Impulsive moves on the setups after a good price action is formed as per the strategy. we never get into corrective moves. because it will test our patience and also it will be a bullish or a bearish trap. and try trade the big moves.
we do not get into bullish or bearish traps. We anticipate and get into only big bullish or bearish moves (Impulsive Moves). Just ride the Bullish or Bearish Impulsive Move. Learn & Know the Complete Market Cycle.
Buy Low and Sell High Concept. Buy at Cheaper Price and Sell at Expensive Price.
Please keep your comments useful & respectful.
Keep it simple, keep it Unique.
Thanks for your support
Tradelikemee Academy
Saanjayy KG

"U" Shape Pattern* 6 Month Tight Consolidation touched on Support & Resistance multiple times, and breakout
* 14 Year Consolidation touched on resistance multiple times trend line Year Nov-11 TO July-24.
* Expected To reach at the next level. Price level - 195.

IDBI Bank-Short term-Penny Stock- Acceleration required!!
09.08.2024
Buy 98
Target 144
Stoploss 74
Risk-reward- 01:02
Holding time: 3-6 Months
1. Inside candle breakout with good support from RSI
2. Now price has reached 10 year old level.
3, Price reclaimed from 50% Fibonacci
4. Volumes are very good in upward movement and
decreased volumes during retracement.
5. Price rejected at resistance turned support
zone also crossed 21 EMA
6. Price is under consolidation from 6 months in same zone
7. Fundamentals are very good.
NSE:IDBI

IDBI BANK - Short Trade, Profit Target 3 Done using RisologicalIDBI BANK - Short Trade
Guys,
Just look at this one sided move of IDBI Bank.
Trade Entry on 26 August at 98
CMP - 88!
Trailing stop loss at 93.
The price might reach 85-86
Thats the last target shown on the chart.
I love such stress-free trades TBH :)

IDBI Bank-Short term-Penny Stock- Acceleration required!!
09.08.2024
Buy 98
Target 144
Stoploss 74
Risk-reward- 01:02
Holding time: 3-6 Months
1. Inside candle breakout with good support from RSI
2. Now price has reached 10 year old level.
3, Price reclaimed from 50% Fibonacci
4. Volumes are very good in upward movement and
decreased volumes during retracement.
5. Price rejected at resistance turned support
zone also crossed 21 EMA
6. Price is under consolidation from 6 months in same zone
7. Fundamentals are very good.
NSE:IDBI

IDBI52 Week High Breakout.
Box Pattern .
Huge Volumes.
Accumulation Done.
Above all key EMA.
Good for Short Term.
Do Like ,Comment , Follow for regular Updates...
Keep Learning ,Keep Earning...
Disclaimer : This is not a Buy or Sell recommendation. I am not SEBI Registered. Please consult your financial advisor before making any investments . This is for Educational purpose only.

IDBI BANK LTDThis stock breakout major trendline and resistance level so future up move will come
this is only for educational purpose
IDBI BANK MAY BE SHOW A GOOD UP SIDE 20% IDBI Bank may be show a very good upside in coming days approximate 20 to 25% in few days till Budget


IDBI BANKBreakout and retest then create good swing opportunity and TGT will be upto 40%
This is only for educational purpose

IDBIOn 10 years breakout.
enter 70-80...
it can blast as well but mkt at peak so invest according to risk and add dips.
No SL and only positional

EXPECTED IMPORTANT DIRECTIONAL LEVELS FOR THE YEAR 2024Hey Folks..!
I have marked all the important directional level for this year.
All the levels have the description, Bullish movements is expected in bullish range and Downside is expected in the bearish range.
Use the levels either Standalone or Club these levels with your existing trading style & strategy it will surely give you an edge.
If in case at any point of time IDBI BANK goes beyond these levels then i will either post additional levels in as an update or i will republish the idea with more levels.
Rules are simple , Short trades can work well in the Red / Bearish ranges whereas Long trades can work well in the Bullish ranges.
All the Best Folks ! Stay tuned for updates.

IDBISimple Price Action
Formed multiple InsideBar in weekely Time frame
Gave Powerfull Breakout Of multiple Inside Bar with Strong Volume
Looks Good For Swing Trade
Trading at 79
Keep sl at 59
Target can be 110 / 150
Disclaimer :- script disscussed only for education purpose. It is not any recommendation to buy or sell. You will be fully responsible for your profit and losses. If you have any question about my analysis, you can whatsaasp me on 9730763736.
