IEX Let's see it work or notRSI below 60 monthly basis
resistance 165
golden cross over
Higher high higher low forming
Moving Average in line forming 20 / 50 / 100 (still below 200) / 200
major support 138
anything else need to watch
yes last but not least sentiments
IEX trade ideas

Indian Energy ExchangeElliots Wave 3 is getting formed and your Target would be as below
If you see the Weekly Graph also, this Target gets double confirmed
Target 230

Reverse Head & Shoulder pattern in IEX on weekly chartAfter almost 2 year of consolidation IEX form a Reverse Head & shoulder pattern & give breakout above neck line as per chart target will be around 230 ,with a stoploss of 175

Rounding Bottom long 2 years consolidation break out
Rounding bottom breakout
Rectangle pattern breakout
Targets mark on the chart

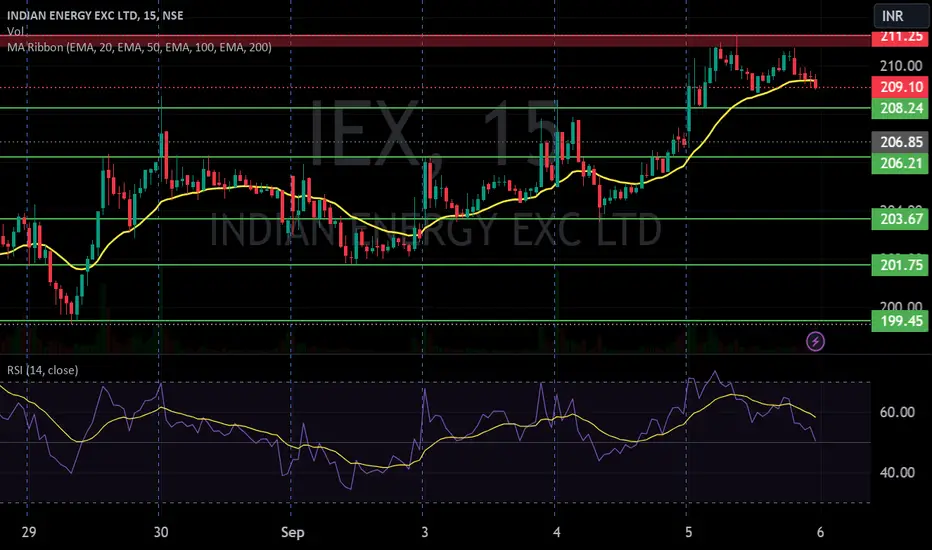
IEX S/R for 18/9/24Support and Resistance Levels:
Support Levels: These are price points (green line/shade) where a downward trend may be halted due to a concentration of buying interest. Imagine them as a safety net where buyers step in, preventing further decline.
Resistance Levels: Conversely, resistance levels (red line/shade) are where upward trends might stall due to increased selling interest. They act like a ceiling where sellers come in to push prices down.
Breakouts:
Bullish Breakout: When the price moves above resistance, it often indicates strong buying interest and the potential for a continued uptrend. Traders may view this as a signal to buy or hold.
Bearish Breakout: When the price falls below support, it can signal strong selling interest and the potential for a continued downtrend. Traders might see this as a cue to sell or avoid buying.
20 EMA (Exponential Moving Average):
Above 20 EMA: If the stock price is above the 20 EMA, it suggests a potential uptrend or bullish momentum.
Below 20 EMA: If the stock price is below the 20 EMA, it indicates a potential downtrend or bearish momentum.
Trendline: A trendline is a straight line drawn on a chart to represent the general direction of a data point set.
Uptrend Line: Drawn by connecting the lows in an upward trend. Indicates that the price is moving higher over time. Acts as a support level, where prices tend to bounce upward.
Downtrend Line: Drawn by connecting the highs in a downward trend. Indicates that the price is moving lower over time. It acts as a resistance level, where prices tend to drop.
RSI: RSI readings greater than the 70 level are overbought territory, and RSI readings lower than the 30 level are considered oversold territory.
Combining RSI with Support and Resistance:
Support Level: This is a price level where a stock tends to find buying interest, preventing it from falling further. If RSI is showing an oversold condition (below 30) and the price is near or at a strong support level, it could be a good buy signal.
Resistance Level: This is a price level where a stock tends to find selling interest, preventing it from rising further. If RSI is showing an overbought condition (above 70) and the price is near or at a strong resistance level, it could be a signal to sell or short the asset.
Disclaimer:
I am not a SEBI registered. The information provided here is for learning purposes only and should not be interpreted as financial advice. Consider the broader market context and consult with a qualified financial advisor before making investment decisions.

Rounding Bottom After Almost 2 years of consolidation this stock is in a breakout mode.
For study purpose only

Bullish flag pattern breakout in IEXIEX give Bullish flag pattern Breakout on monthly chat ,With Very good volume support.First Target should be arround 190 & Seccond should be 210

IEX S/RSupport and Resistance Levels:
Support Levels: These are price points (green line/shade) where a downward trend may be halted due to a concentration of buying interest. Imagine them as a safety net where buyers step in, preventing further decline.
Resistance Levels: Conversely, resistance levels (red line/shade) are where upward trends might stall due to increased selling interest. They act like a ceiling where sellers come in to push prices down.
Breakouts:
Bullish Breakout: When the price moves above resistance, it often indicates strong buying interest and the potential for a continued uptrend. Traders may view this as a signal to buy or hold.
Bearish Breakout: When the price falls below support, it can signal strong selling interest and the potential for a continued downtrend. Traders might see this as a cue to sell or avoid buying.
20 EMA (Exponential Moving Average):
Above 20 EMA: If the stock price is above the 20 EMA, it suggests a potential uptrend or bullish momentum.
Below 20 EMA: If the stock price is below the 20 EMA, it indicates a potential downtrend or bearish momentum.
Trendline: A trendline is a straight line drawn on a chart to represent the general direction of a data point set.
Uptrend Line: Drawn by connecting the lows in an upward trend. Indicates that the price is moving higher over time. Acts as a support level, where prices tend to bounce upward.
Downtrend Line: Drawn by connecting the highs in a downward trend. Indicates that the price is moving lower over time. It acts as a resistance level, where prices tend to drop.
RSI: RSI readings greater than the 70 level are overbought territory, and RSI readings lower than the 30 level are considered oversold territory.
Combining RSI with Support and Resistance:
Support Level: This is a price level where a stock tends to find buying interest, preventing it from falling further. If RSI is showing an oversold condition (below 30) and the price is near or at a strong support level, it could be a good buy signal.
Resistance Level: This is a price level where a stock tends to find selling interest, preventing it from rising further. If RSI is showing an overbought condition (above 70) and the price is near or at a strong resistance level, it could be a signal to sell or short the asset.
Disclaimer:
I am not a SEBI registered. The information provided here is for learning purposes only and should not be interpreted as financial advice. Consider the broader market context and consult with a qualified financial advisor before making investment decisions.
Technical Analysis of Indian Energy Exc Ltd (IEX)Technical Analysis of Indian Energy Exc Ltd (IEX)
Overview of the Stock - The chart shows the 1-hour timeframe of Indian Energy Exc Ltd (IEX) on the National Stock Exchange (NSE). The key technical indicators and patterns suggest a potential bullish trend, but caution is advised due to recent volatility.
Key Observations
Uptrend: The price has been in an overall uptrend, indicated by the rising support and resistance levels.
Support and Resistance: The green horizontal lines represent support levels, while the red lines indicate resistance levels. The price has been consistently bouncing off support levels, suggesting a bullish bias.
Moving Averages: The 50-day and 200-day moving averages are both upward sloping, further supporting the bullish trend.
Bollinger Bands: The price is currently trading above the upper Bollinger Band, indicating a strong bullish momentum. However, this overbought condition could lead to a potential pullback.
Relative Strength Index (RSI): The RSI is currently above 70, suggesting overbought conditions. A pullback to the oversold zone (below 30) might be expected before a continuation of the uptrend.
Trendline: The upward sloping trendline provides support to the price. A break below this trendline could signal a potential reversal.
Potential Scenarios
Continuation of Uptrend: If the price continues to hold above the support levels and the trendline, a further uptrend is possible. The next resistance levels to watch are around 250 and 260.
Pullback: Given the overbought conditions, a pullback to the 200-day moving average or the lower Bollinger Band could be expected before a continuation of the uptrend.
Reversal: A break below the trendline and support levels could indicate a potential reversal. However, this would require confirmation from other technical indicators.
Trading Recommendations
Buy: If the price holds above the support levels and shows signs of bullish reversal (e.g., bullish candlestick patterns, positive divergence), a buy position could be considered.
Stop-Loss: A stop-loss can be placed below the recent support level to limit potential losses.
Take-Profit: Targets can be set at the next resistance levels or based on risk-reward ratios.
Remember to conduct your own thorough analysis and consider other factors such as fundamental analysis, market news, and risk tolerance before making any investment decisions.
Disclaimer: This analysis is based on the provided chart and is for informational purposes only. It does not constitute financial advice. Always consult with a financial advisor before making investment decisions. Do your own research before buying this stock because I am not SEBI registered person and this is just for educational purposes. We are not responsible for your loss.
Thanks for your support as always

IEX - Bullish oNStock name - Indian Energy Exchange Limited
✅#IEX
✅Next resistance 242
✅Moved 21% in 35 Weeks.
Weekly chart setup
Chart is self explanatory everything.
Master score -
Disclaimer : This is for demonstration and education purpose only. This is not buying or selling recommendations. I'm not SEBI registered.

Indian Energy Exchange LTD (IEX)- Break out in WeeklyDear All, This stock has given breakout of resistance in weekly chart. First target is 250 and second target is 290. Buy and wait.

SWING IDEA - IEXIndian Energy Exchange (IEX) is exhibiting promising technical signals that suggest a potential swing trade opportunity.
Reasons are listed below :
170 Zone as New Support : The 170 level was previously a resistance zone and has now turned into a support level, indicating strong buying interest.
Hammer Candle on Weekly Timeframe : The formation of a hammer candle on the weekly chart suggests a potential reversal, signaling a shift from a bearish to a bullish trend.
0.5 Fibonacci Support : The stock has found support at the 0.5 Fibonacci retracement level, indicating a potential bounce and continuation of the uptrend.
Trading Above 50 and 200 EMA on Weekly Timeframe : IEX is trading above the 50 and 200-week exponential moving averages, confirming the bullish sentiment and providing strong support levels.
Breaking Consolidation Phase of 2+ Years : The stock is breaking out of a long consolidation phase that lasted over two years, signaling the start of a new bullish trend.
Target - 205 // 245 // 300
Stoploss - weekly close below 155
DISCLAIMER -
Decisions to buy, sell, hold or trade in securities, commodities and other investments involve risk and are best made based on the advice of qualified financial professionals. Any trading in securities or other investments involves a risk of substantial losses. The practice of "Day Trading" involves particularly high risks and can cause you to lose substantial sums of money. Before undertaking any trading program, you should consult a qualified financial professional. Please consider carefully whether such trading is suitable for you in light of your financial condition and ability to bear financial risks. Under no circumstances shall we be liable for any loss or damage you or anyone else incurs as a result of any trading or investment activity that you or anyone else engages in based on any information or material you receive through TradingView or our services.
@visionary.growth.insights

IEX Targeting ₹252 and ₹325 I bought Indian Energy Exchange Ltd (IEX) at ₹201, targeting ₹252 and ₹325 within one year, with a stop loss set below ₹185. IEX is a leading power trading platform in India, offering an efficient, transparent, and automated exchange for electricity trading. The company boasts strong fundamentals, with a high return on equity (ROE) of 37.7% and minimal debt, making it a solid long-term investment. Despite its high valuation, IEX's growth potential in India's energy market makes it a compelling buy at current levels.

52 Week High Breakout Startegy - Positional Trade Long TermDisclaimer: I am Not SEBI Registered adviser, please take advise from your financial adviser before investing in any stocks. Idea here shared is for education purpose only.
Stock is near 52 week high break out. Buy above the High and do not forget to keep stop loss best suitable for Positional Trading long Term. Keep this stock in watch list.
Target and Stop loss Shown on Chart. Initial Target Ratio 1:2. Exit only if Stock Price Close below 30 SMA on Weekly Chart.
Be Discipline, because discipline is the key to Success in Stock Market.
Trade what you See Not what you Think.

IEX long positionA closing of IEX above 160 with good volumes can take it to 200 level. You can consider it for long term

IEX flying may touch all time highIEX can double from here with in few years. Sl below the trend line.
Chart is self explanatory. Please follow the price action & take the trade as per your appetite.
The information provided here is only for educational purpose. The information provided here is not intended to be any kind of financial advice, investment advice, and trading advice. Investment in stock market is very risky and trading stocks, options and other securities involve risk. The risk of loss in stock market can be substantial. Moreover, I am not a SEBI registered analyst, so before taking any decision or before investing in any Share consult your financial advisor and also do your analysis and research.
Request your support and engagement by liking and commenting & follow to provide encouragement.

Short term technical tradePrice broken almost 2 yrs consolidation and retesed key resistance with strong volumes.....Buying zone 180-185 if comes....Sl below 171 closing basis....only for educational purpose and not any recommendation

IEXNSE:IEX NSE:IEX Weekly chart rounding bottom with macd momentum and outperforming stock from last 4 months.

iex breakout Indian energy exchange looking good and ready for 220 to 250
time frame 3 months
monopoly and good dividend stock
note i m not sebi registered analysis

Indian Energy Exchange Bulish(Breakout Weekly Timeframe)As we can see i have drawn weekly resistance trendline and price given a clear breakout. I have marked some important levels by using fibonaaci retracement on latest swing which will be acts as a targets. Please keep stop loss as per your risk appetite.

IEX can be added long term Investment!As per my analysis., IEX can be added long term Investment
Important levels - 126 and Stop loss of 105
First Target will be 175
Second Target 230 +
Please comment if you wish to see my analysis any stocks.
Please do your due diligence before trading or investment.
Thank you.


Indian energy exchange It come to it's equilibrium premium zone
Now the price is tend to touch upper fib sequence.
