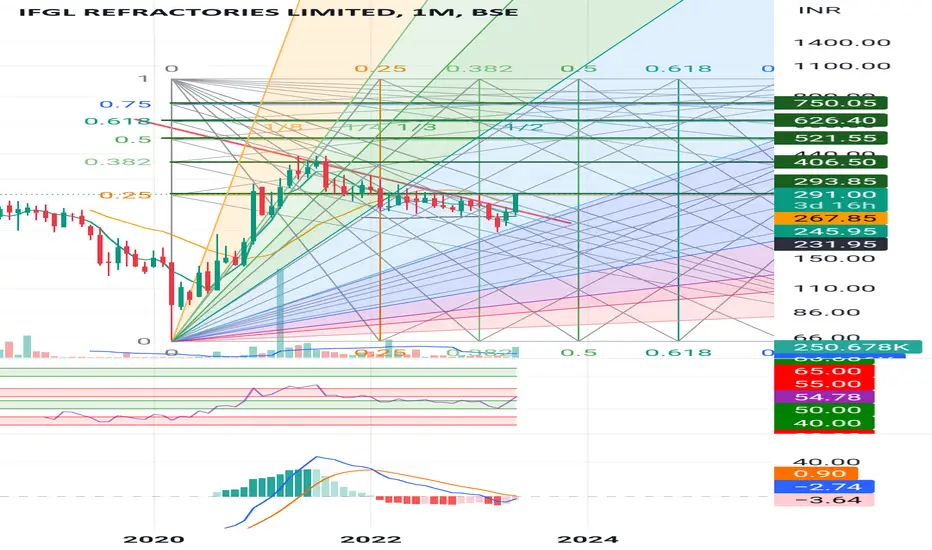
IFGL REFRACTORIES LTD S/RSupport and Resistance Levels:
Support Levels: These are price points (green line/shade) where a downward trend may be halted due to a concentration of buying interest. Imagine them as a safety net where buyers step in, preventing further decline.
Resistance Levels: Conversely, resistance levels (red line/shade) are where upward trends might stall due to increased selling interest. They act like a ceiling where sellers come in to push prices down.
Breakouts:
Bullish Breakout: When the price moves above resistance, it often indicates strong buying interest and the potential for a continued uptrend. Traders may view this as a signal to buy or hold.
Bearish Breakout: When the price falls below support, it can signal strong selling interest and the potential for a continued downtrend. Traders might see this as a cue to sell or avoid buying.
MA Ribbon (EMA 20, EMA 50, EMA 100, EMA 200) :
Above EMA: If the stock price is above the EMA, it suggests a potential uptrend or bullish momentum.
Below EMA: If the stock price is below the EMA, it indicates a potential downtrend or bearish momentum.
Trendline: A trendline is a straight line drawn on a chart to represent the general direction of a data point set.
Uptrend Line: Drawn by connecting the lows in an upward trend. Indicates that the price is moving higher over time. Acts as a support level, where prices tend to bounce upward.
Downtrend Line: Drawn by connecting the highs in a downward trend. Indicates that the price is moving lower over time. It acts as a resistance level, where prices tend to drop.
Disclaimer:
I am not a SEBI registered. The information provided here is for learning purposes only and should not be interpreted as financial advice. Consider the broader market context and consult with a qualified financial advisor before making investment decisions.
IFGLEXPOR trade ideas

IFGLEXPORIFGL REFACTORIES looking good at 470 and stock has fallen 50% from highs due to results and now CAPEX is planned for 300cr..
𝗜𝗙𝗚𝗟 𝗥𝗲𝗳𝗿𝗮𝗰𝘁𝗼𝗿𝗶𝗲𝘀 𝗟𝘁𝗱 announced the incorporation of a new joint venture company, 𝗜𝗙𝗚𝗟−𝗠𝗮𝗿𝘃𝗲𝗹𝘀 𝗥𝗲𝗳𝗿𝗮𝗰𝘁𝗼𝗿𝗶𝗲𝘀 𝗟𝗶𝗺𝗶𝘁𝗲𝗱..
This JV, with Marvels International Group Co Ltd & Marvel Refractories (Anshan) Company Limited, will set up a greenfield facility in India..

IFGLEXPORTSIFGL todays day high will act as a resistance if that is broken we will see good upside till 760 and above that we may see 840++
Disclaimer: only for education purposes, no buy or sell recommendation. we are not sebi registered. always discuss first with your financial advisors

IFGL Refractories long near 435 set alertits a bit far off so if i forget im setting an alert at 435 to enter for long term
company delivered 50%+ increase in sales last 5 years consistently and 100pc profits cagr
going ahead the guidance is conservative at 25/27 % cagr for sales
we all love a company that overshoots its targets considerably ahead of time
if the execution is on track will be a very very good long term story

next level in stock1) runway gap in chart
2) 435 to 530 range of the stock trading from last 94 session
3) stock enter new stage
4) stop loss of 525 or below this level and target of 820 but one sentimental resistance in stock 600 level
5) SMA 20 495 , SMA 50 489, SMA 200 346
6) no recommendation for the stock buy or sell

Resistance BreakoutPlease look into the chart for a detailed understanding.
Consider these for short-term & swing trades with 2% profit.
For BTST trades consider booking
target for 1% - 2%
For long-term trades look out for resistance drawn above closing.
Please consider these ideas for educational purpose

IFGL RefractoriesMonthly BO is expected after a long time where Flag pole BO is already done with good volumes and almost ready to break the Gann box levels too above 293
MACD crossover about to happen.
Gann Fann angle support has already been taken
Weekly chart already looks bullish
Stage 2 breakoutsIFGL exports. Stock making higher high on weekly timeframe. Completed more than 50% correction. Goof for positional bets.

IFGL EXPORT- BUYOn weekly chart making higher high and higher low.Near to long term support.company fundamentally is zero debt high promoter holding of 74%, EPS annual of 19.56 dividend yield of 2.76% and PE of 12.76. It can be considered for portfolio building and accumulation has a reasonable fair value of 350.

IFGL--BREAKOUT3rd wave breakout today will show more power once crosses 289 buy on every dip . longs have a target of more then 380 in long run and 340 in short term .This is a metal stock with zero debt and promotor holding of 74 % approx.

IFGL--BUY LONGSThis metal company's EPS TTM is 20.42 INR, dividend yield is 2.53%, and P/E is 13.46 and zero debt. currently in wave 3(2) once crosses 287 will show real power as it would be 3rd of 3 wave and fibo ext is showing trg of 338/269/388, currently in flag formation and share getting accumulated. Buy at every dip .

IFGL--BUY LONGSIFGL export metal stock with EPS of 21 and managment holding of 75 % and institutional holding of more then 10 % gave a breakout above 272 is in 3rd(2) wave buy near to 276-77 level for a target of 340,362 /380 if trades above this then new high possible.

IFGL--BUYIn refractories business EMA10,20,50,100 RANGE FROM 160-262 ,EMA 200 269. Contracting triangle forming base at 258-262 range buy with a stop of 254 , soon to breakout of contracting triangle. Look at RHIM which is trading at 870 range in same business promotor holding of more then 70 % in both the companies in IFGL institution also hold 11 % and share available at PE of 12.90 and EPS of 21.. while RHIM is nearly the same but PE is very high of 39 result-sell RHIM buy IFGL as soon breakout stock.
