Review and plan for 7th July 2025 Nifty future and banknifty future analysis and intraday plan.
Swing ideas.
This video is for information/education purpose only. you are 100% responsible for any actions you take by reading/viewing this post.
please consult your financial advisor before taking any action.
----Vinaykumar hiremath, CMT
IGL trade ideas

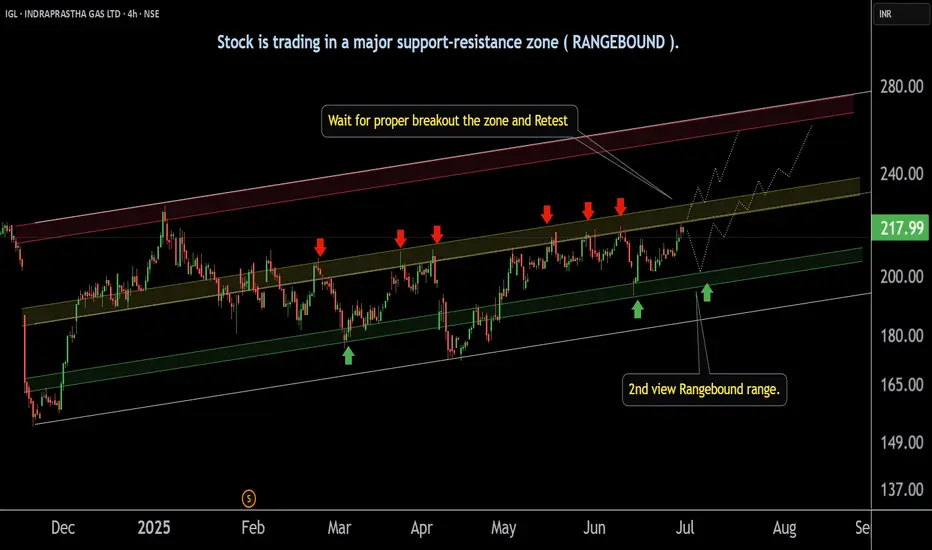
INDRAPRASTHA GAS ' s Support zone | Breakout level |This is the 4 hour chart of INDRAPRASTHA GAS .
IGL is moving in a well defined parallel channel with support range near at 195-200 level.
Igl having good law of polarity at 230 range if Igl give breakout this level and sustain above this level next resistance is near 260 and 280 .
Thank you !!
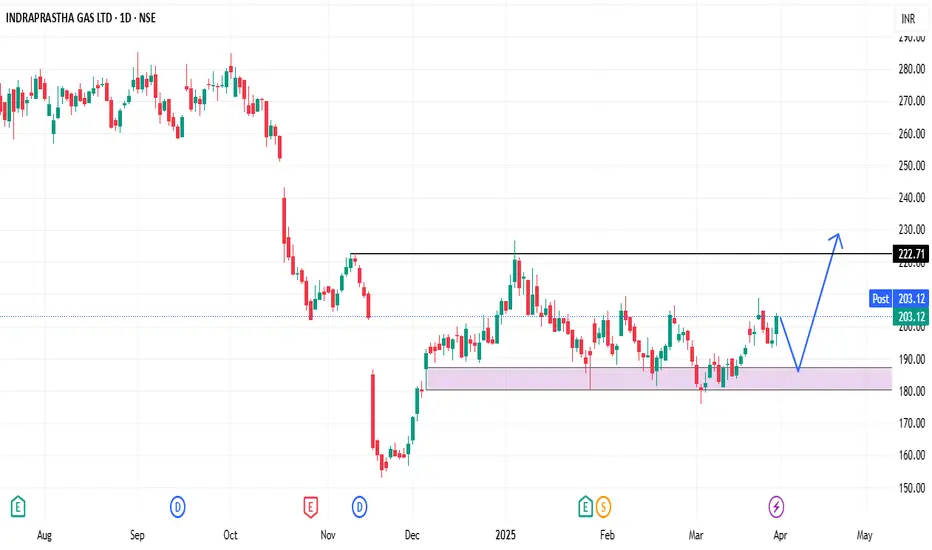
IGL can move back to ATHIGL trying to break the resistance price around 214, once breaks it, slowly IGL can move back to ATH.
IGL : Breakout Stock (Swing Pick)#IGL #breakoutstock #parallelchannelbreakout #Trendingstock
IGL : Swing Trade
>> Parallel Channel Breakout
>> Momentum stock
>> Good Strength & Volumes Dried up
>> Good Upside Potential
>> It could go and Retest the GAP area
Swing Traders can lock profit at 10% and keep trailing
Disc : Stock Charts shared for Learning purpose and not a Trade recommendation. Do your own Research and analysis or Consult your Financial advisor or a SEBI Registered Advisor before taking position

Igl breakout long consolidation Igl breakout long consolidation it's sustainable above the price it's going to next level

IGL SWING TRADE 📊 Price Action & Trend Analysis
Analyzing market trends using price action, key support/resistance levels, and candlestick patterns to identify high-probability trade setups.
Always follow the trend and manage risk wisely!
Price Action Analysis Interprets Market Movements Using Patterns And Trends On Price Charts.
👉👉👉Follow us for Live Market Views/Trades/Analysis/News Updates.
IGL CMP 384.Around 330 level was a multi time and super strong support for this stock.Company is fundamentaly strong for Investment.It was bearish for short term But long term is is available at best valuation prices.If sustain above levels than we can see 430........450.......500 levels in coming days.I am not sebi regestered than take your own Risk Reward.Add this to your wachlist and see how it perform in coming days .Thanks for your support.

Indraprastha Gas Ltd view for Intraday 6th Dec #IGL Indraprastha Gas Ltd view for Intraday 6th Dec #IGL
Resistance 385. Watching above 386 for upside movement...
Support area 378-380 Below 378-380 ignoring upside momentum for intraday
Support 378-380 Watching below 378 for downside movement...
Resistance area 385
Above 385 ignoring downside move for intraday
Charts for Educational purposes only.
Please follow strict stop loss and risk reward if you follow the level.
Thanks,
V Trade Point

IGLIGL stock is looking good for intraday today.
I'm expecting stock to be bullish on first 5 mins candle high breakout

IGL..Gassy Ideas BuyGave a good breakout..buy with stoploss mentioned...volumes are good too..so risk is minimal compared to reward..Please read the chart for more details..everything is mentioned on chart


IGL bullish flag buyIGL formed bullish flag however target seems low. this stock can be watched to see whether it's reaching the target.

IGL chart analysisIGL chart analysis on daily time frame. This stock is at good support and can bounce from here.
Please share your feedback and follow for more such charts.

Indraprastha Gas Ltd view for Intraday 4th October #IGL Indraprastha Gas Ltd view for Intraday 4th October #IGL
Buying may witness above 561
Support area 553-555. Below ignoring buying momentum for intraday
Selling may witness below 546
Resistance area 555
Above ignoring selling momentum for intraday
Charts for Educational purposes only.
Please follow strict stop loss and risk reward if you follow the level.
Thanks,
V Trade Point

IGL - Weekly Inv H&SI believe Inv H&S formation is underway. Initially we could see 500 and then a consolidation before hitting 575

Indraprastha Gas Ltd view for Intraday 25th September #IGL Indraprastha Gas Ltd view for Intraday 25th September #IGL
Buying may witness above 554
Support area 545. Below ignoring buying momentum for intraday
Selling may witness below 545
Resistance area 554
Above ignoring selling momentum for intraday
Charts for Educational purposes only.
Please follow strict stop loss and risk reward if you follow the level.
Thanks,
V Trade Point

Indraprastha Gas Ltd-Bullish swing- Will this trend continue?
30.07.2024
Buy 553
Target 589.5
Stop Loss 517
Risk: Reward - 01:01
1. Inside candle breakout in day TF
2. Upward channel and previous resistance breakout
3. Retracement after breakout at good FVG and thus resistance turned to support
4. Oil & Gas sector is in good momentum
5. Good Volume breakout
6. Price rejection from 21 EMA NSE:IGL

50 SMA Rising - Positional TradeDisclaimer: I am not a Sebi registered adviser.
This Idea is publish purely for educational purpose only before investing in any stocks please take advise from your financial adviser.
It 50 SMA Rising. Suitable for Positional Trading Initial Stop loss lowest of last 2 candles and keep trailing with 50 days SMA if price close below 50 SMA then Exit or be in the trade some time trade can go for several months.
Be Discipline because discipline is the Key to Success in the STOCK Market.
Trade What you see not what you Think

IGL-Breakout Of Triangle PatternTriangles tend to be bullish as they indicate the continuation of an upward trend.


IGLResisitance broken, oi analysis short covering happenung. Once it break yesterdays high can look for a buying setup.
Do your own analysis.

Review and plan for 25th July 2024Nifty future and banknifty future analysis and intraday plan in kannada.
Stocks to watch.
This video is for information/education purpose only. you are 100% responsible for any actions you take by reading/viewing this post.
please consult your financial advisor before taking any action.
----Vinaykumar hiremath, CMT

SWING IDEA - INDRAPRASTHA GAS (IGL)Consider a compelling swing trade opportunity in Indraprastha Gas Limited (IGL) , a leading natural gas distribution company in India.
Reasons are listed below :
Attempt to Break Triangle Pattern : IGL is attempting to break out of a triangle pattern, indicating a potential shift in market sentiment and the beginning of a new trend.
Bullish Marubozu on Daily Timeframe : The presence of a bullish Marubozu candlestick pattern on the daily timeframe signals strong buying momentum and potential upward movement.
Broke Consolidation of 5 Months : IGL has broken out of a consolidation phase lasting 5 months, suggesting a breakout from range-bound trading and potential sustained upward movement.
50 and 200 EMA Support on Weekly Timeframe : The stock finds support at both the 50 and 200 Exponential Moving Averages (EMA) on the weekly timeframe, indicating bullish momentum and potential for trend continuation.
Constant Higher Highs : IGL consistently forms higher highs, reflecting a trend of increasing bullish momentum and reinforcing the potential for further gains.
Target - 515 // 585
Stoploss - weekly close below 394
DISCLAIMER -
Decisions to buy, sell, hold or trade in securities, commodities and other investments involve risk and are best made based on the advice of qualified financial professionals. Any trading in securities or other investments involves a risk of substantial losses. The practice of "Day Trading" involves particularly high risks and can cause you to lose substantial sums of money. Before undertaking any trading program, you should consult a qualified financial professional. Please consider carefully whether such trading is suitable for you in light of your financial condition and ability to bear financial risks. Under no circumstances shall we be liable for any loss or damage you or anyone else incurs as a result of any trading or investment activity that you or anyone else engages in based on any information or material you receive through TradingView or our services.
@visionary.growth.insights
