IMFA trade ideas

FOR SWING TRADEIMFA (Indian Metals & Ferro Alloys Ltd)
1DAY TF
BUYING ENTRY-930-9365
SL- 850
TG-950-970-980++
(FUNDAMENTALLY GOOD STOCK)
Indian Metals and Ferro Alloys Limited (IMFA) is a leading, fully integrated producer of Ferro Chrome in India which is primarily used in the production of stainless steel. It was set up in 1961.

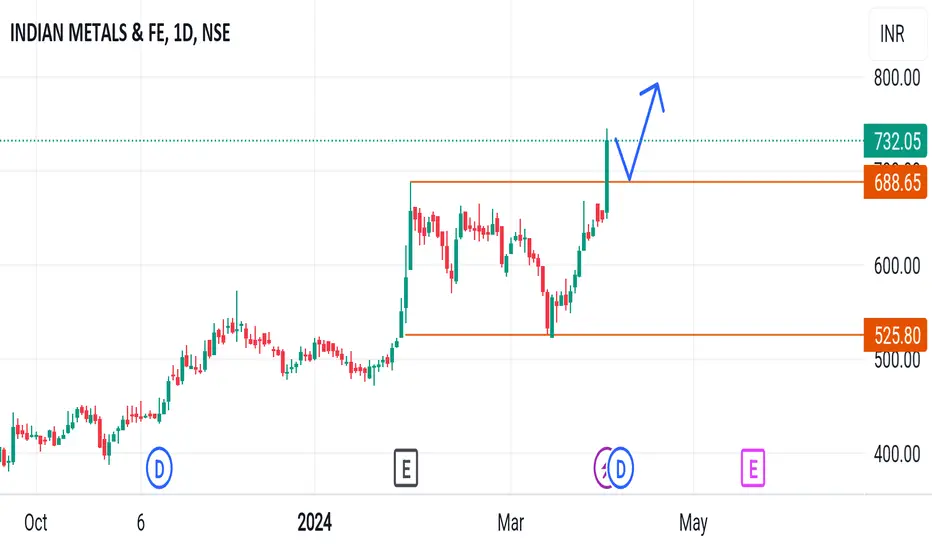
INDIAN METALS & FERRO S/RSupport and Resistance Levels:
Support Levels: These are price points (green line/shade) where a downward trend may be halted due to a concentration of buying interest. Imagine them as a safety net where buyers step in, preventing further decline.
Resistance Levels: Conversely, resistance levels (red line/shade) are where upward trends might stall due to increased selling interest. They act like a ceiling where sellers come in to push prices down.
Breakouts:
Bullish Breakout: When the price moves above resistance, it often indicates strong buying interest and the potential for a continued uptrend. Traders may view this as a signal to buy or hold.
Bearish Breakout: When the price falls below support, it can signal strong selling interest and the potential for a continued downtrend. Traders might see this as a cue to sell or avoid buying.
20 EMA (Exponential Moving Average):
Above 20 EMA(50 EMA): If the stock price is above the 20 EMA, it suggests a potential uptrend or bullish momentum.
Below 20 EMA: If the stock price is below the 20 EMA, it indicates a potential downtrend or bearish momentum.
Trendline: A trendline is a straight line drawn on a chart to represent the general direction of a data point set.
Uptrend Line: Drawn by connecting the lows in an upward trend. Indicates that the price is moving higher over time. Acts as a support level, where prices tend to bounce upward.
Downtrend Line: Drawn by connecting the highs in a downward trend. Indicates that the price is moving lower over time. It acts as a resistance level, where prices tend to drop.
RSI: RSI readings greater than the 70 level are overbought territory, and RSI readings lower than the 30 level are considered oversold territory.
Combining RSI with Support and Resistance:
Support Level: This is a price level where a stock tends to find buying interest, preventing it from falling further. If RSI is showing an oversold condition (below 30) and the price is near or at a strong support level, it could be a good buy signal.
Resistance Level: This is a price level where a stock tends to find selling interest, preventing it from rising further. If RSI is showing an overbought condition (above 70) and the price is near or at a strong resistance level, it could be a signal to sell or short the asset.
Disclaimer:
I am not a SEBI registered. The information provided here is for learning purposes only and should not be interpreted as financial advice. Consider the broader market context and consult with a qualified financial advisor before making investment decisions.

High targets expected It's creating a very good swing pattern you can analyse and invest according to your knowledge.

IMFA - Breakout tradeThe stock is poised for a breakout move above it's all time high. Trend and RSI Momentum intact.
My SL would be strictly at 624, target - 711.

Right angled descending broadening wedge patternIMFA formed a right angled descending broadening wedge pattern. This is a bullish pattern with bullish breakout happened three sessions earlier. Price inched higher than the breakout candle high today forming an ideal entry today with stop loss just below breakout candle low. There was high volume during breakout and prior to formation of the pattern indicating buyers are out there. Target can be the size of wider side of broadening wedge.
Hope you liked this idea. If you like this idea please boost it or leave a comment below on what you think. Otherwise, happy trading :-).

IMFA | BreakoutIMFA is under breakout . Consider buying only after getting a closing green candle above the trend line. Target and Stop loss mentioned
Disclaimer: Education Purpose Only

IMFA: Micro Cap Gem - A Favorable Outlook for Potential Swing International Mining and Fertilizer Association (IMFA) is emerging as an intriguing opportunity in the micro-cap segment, presenting a promising narrative for swing traders seeking short to medium-term positions. The company's recent performance and chart indicators indicate a conducive environment for potential gains in the near future.
Key Highlights for Swing Traders:
Technical Momentum:
Chart Patterns: IMFA's charts reveal notable technical momentum, with key indicators suggesting favorable conditions for a swing trade. The stock's recent price movements and potential breakout patterns are catching the attention of traders.
Micro-Cap Potential:
Untapped Opportunity: Being a micro-cap, IMFA holds the potential for swift and significant price movements. Swing traders often find such stocks attractive for capitalizing on short to medium-term trends.
Market Sentiment:
Positive Catalysts: Positive sentiments surrounding IMFA, potentially driven by company-specific developments or industry trends, contribute to the stock's appeal for swing trading opportunities.
Volatility Advantage:
Price Swings: Micro-cap stocks often exhibit higher volatility, providing traders with opportunities to benefit from price swings within relatively short timeframes.
Sector Dynamics:
Industry Resilience: A closer look at IMFA's industry and sector dynamics may reveal resilience and growth prospects, further supporting the case for swing trades in this micro-cap gem.
As swing traders evaluate potential opportunities in IMFA, it is crucial to conduct thorough research. This includes an analysis of both technical indicators and fundamental aspects to make well-informed trading decisions. Additionally, staying updated on market conditions, monitoring for potential catalysts, and employing risk management strategies are essential for successful swing trading endeavors.
While micro-cap stocks can offer exciting trading prospects, it's important to note that they come with inherent risks. Swing traders should approach IMFA with diligence, utilizing technical analysis tools and considering individual risk tolerance. Consulting with financial professionals or advisors can provide personalized insights for crafting effective strategies in the dynamic realm of micro-cap swing trades.

IMFA trying to break its 52wk high levels.If Indian Metals Sustains above 500 levels in next week,
it can easily rally for 25% up side.

Indian Metals & Ferro Alloys for investmentGood fundamentals
Company has reduced debt.
Stock is trading at 0.71 times its book value
Stock is providing a good dividend yield of 4.17%.
Company is expected to give good quarter
Good to accumlate around 200 to 250,
SL 170 CLB.
Saptarish Trading
Views are for education only, not a SEBI registered advisor.

IMFA BSTVery big breakout of resistance
Previously it gave breakout but price was not able to sustain, now it looks like it might sustain
mcap 2570cr
stock pe 9.23 vs industry pe 12.5
cmp 476 vs book value 379
dividend 2.10%
debt to eq 0.18
promoter holding 58.7% vs 58.88% in MARCH 2017
bought yesterday

💥Indian Metals & Ferro Alloys Ltd💥- Nice Breakout 💥Indian Metals & Ferro Alloys Ltd💥- Nice Breakout
Capital to be deployed- 20k
Investing Price -420-425
Breakout Price -419
Stoploss-335
Targets -587-625-1625
RT for max reach.
#imfa #StocksToBuy #stockstowatch #stocks #StocksInFocus

Potential Uptrend for IMFAIntroduction:
In this analysis, we will be discussing the recent price action of IMFA and the potential for an uptrend. We will be using both the daily and monthly charts to gain a better understanding of the current market sentiment and the potential for future price movements.
Daily Chart:
The daily chart shows a clear breakout above the trendline that formed the elevated step. This breakout is a bullish sign and suggests that the price may continue to rise. The daily RSI is also above 50, indicating that the price is currently in an uptrend.
Monthly Chart:
The monthly chart shows a clear support and resistance band. The support band and the resistance band is at around 436. The price is currently trading above the support band, which is a bullish sign. Additionally, the monthly RSI is above 50, which also indicates that the price is currently in an uptrend.
Conclusion:
Based on the analysis of the daily and monthly charts, it appears that there is potential for an uptrend in the price of IMFA. The breakout above the trendline and the monthly support and resistance bands are both bullish signs. However, it is important to note that past performance is not indicative of future results and that investors should always do their own research and consult with a financial advisor before making any investment decisions.

Buy Now or Regret Later 🤑🚀🚀🙏🙏Bullish ....
Moon Very Soon . 🚀🚀🚀🚀
After a good rally and just retesting and take your entry around 270 and wait for the Mon .. clear 20-25% Upside Move ..


IMFA 100% returns in one monthIMFA almost doubled in one month. Shared on 23rd June on Trading view and now see almost at 1000 levels. Partyy!!

Buy IMFAIMFA has given multiple top breakout at all time high. It has broken resistance after 4 years. Very good stock for long term investment. Short term targets are mentioned in the chart with SL.
Long term targets - 1221, 1921, 2622 and 3055. Please keep SL as per possible reward and your own risk appetite.
View - Long term
Duration - 2 Years.


Powerplay trade - clear breakout - ride with the trendPowerplay is a shallow consolidation post significant up move.

IMFA returned from supportRebounded from 8/1 support, broke descending angle pattern, crossed 4/1. May go above 400 on monday.

Will go back to 400 immediatelyThe support at 371 has been broken today, but it is hoped that 400 level will be achieved in a couple of days.

