INDIGO READY TO FLYINDIGO is nearing to all time high and now ready to FLY to make new Higher Highs.
INDIGO trade ideas

INTERGLOBE AVIATION looks weak if prvious week's low breachedINTERGLOBE AVIATION LOOKS WEAK IF PREVIOUS Week'S low breached
inveted hammer formed on weekly chart

long term📊 Chart Overview
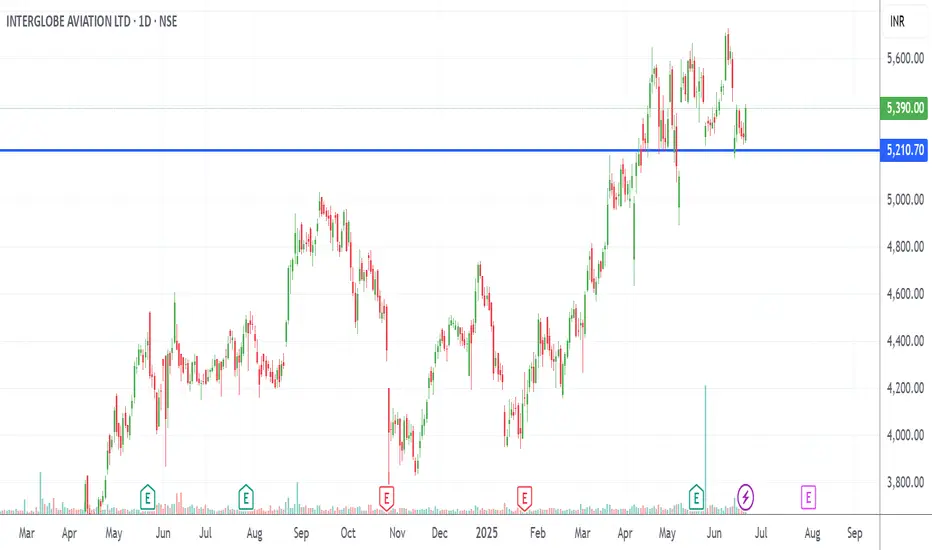
Current Market Price (CMP): ₹5,390.00
Day's Range: ₹5,241.50 – ₹5,408.00
Change: +₹119.00 (+2.26%)
Support Level: ₹5,210.70 (marked on chart)
🔍 Technical Insights
Support Retest at ₹5,210:
Strong support level at ₹5,210 has been successfully retested multiple times.
Recent dip bounced cleanly from this support—bullish signal.
Sideways Consolidation (Range):
The stock has been consolidating between ₹5,200–₹5,600.
Current move from support suggests another attempt toward the upper band.
Price Action:
Long lower wick candles near support indicate buying interest at dips.
Friday’s green candle shows a strong bullish response from buyers.
Volume Confirmation:
Spike in volume on the bounce from ₹5,210 supports bullish outlook.
Need follow-up volume in coming days for a confirmed move.
✅ Buying Strategy
Entry Option 1: Range Trade
Buy Now (~₹5,390)
Target: ₹5,580–₹5,600 (range top)
SL: ₹5,190 (just below support zone)
Entry Option 2: Breakout Trade
Buy on breakout above ₹5,600
Retest Buy: If breakout occurs, enter on a dip back to ₹5,550–₹5,580
Target: ₹5,850 → ₹6,000+
SL: ₹5,470
⚠️ Risk Watch
Breakdown below ₹5,200 with volume invalidates bullish bias.
This is a sideways zone—avoid over-leverage until a breakout.
Watch broader market and sector sentiment (aviation-related news or crude oil prices can impact INDIGO).
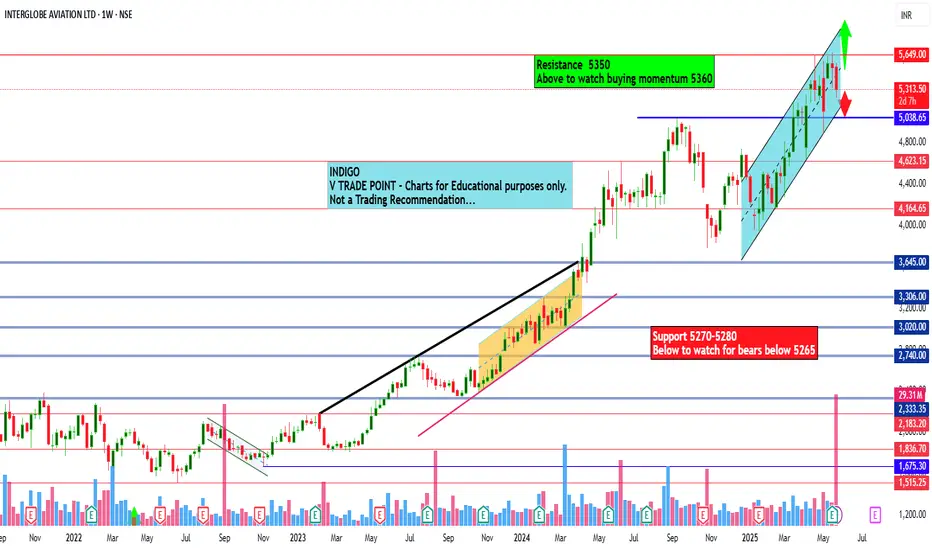
Interglobe Aviation Ltd view for Intraday 28th May #INDIGO Interglobe Aviation Ltd view for Intraday 28th May #INDIGO
Resistance 5350 Watching above 5360 for upside momentum.
Support area 5270-5280 Below 5300 ignoring upside momentum for intraday
Watching below 5265 for downside movement...
Above 5300-5310 ignoring downside move for intraday
Charts for Educational purposes only.
Please follow strict stop loss and risk reward if you follow the level.
Thanks,
V Trade Point
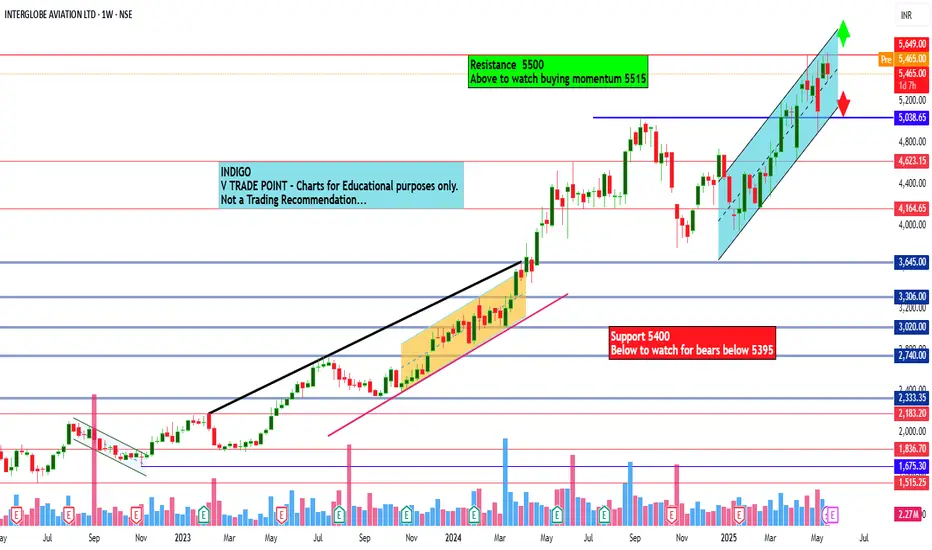
Interglobe Aviation Ltd view for Intraday 22nd May #INDIGO Interglobe Aviation Ltd view for Intraday 22nd May #INDIGO
Resistance 5500 Watching above 5515 for upside momentum.
Support area 5400 Below 5450 ignoring upside momentum for intraday
Watching below 5395 for downside movement...
Above 5450 ignoring downside move for intraday
Charts for Educational purposes only.
Please follow strict stop loss and risk reward if you follow the level.
Thanks,
V Trade Point
INDIGO - Resistance Zone with RSI Divergence| Possible Reversal?Stock is currently testing a strong resistance zone around ₹5649, which has previously acted as a supply area. Despite bullish momentum, the RSI is showing bearish divergence, as marked by red arrows, each price high is not supported by a higher RSI peak.
🔍 Key Observations:
Price is at previous swing high zone.
Bearish RSI Divergence indicating possible momentum loss.
Volumes are not confirming a breakout yet.
Risk-Reward setup looks favorable for short-side trade if rejection seen.
🧠 Plan:
Watch for price rejection at this level.
Short below ₹5580 with SL above ₹5650.
Potential target around ₹5150-5200 zone (previous support).
🕵️♂️ Wait for confirmation candle before entry. This setup is ideal for short-term positional traders with strict risk management.

IndiGo (InterGlobe Aviation): Breaking Out to New Highs! 🚀 IndiGo (InterGlobe Aviation): Breaking Out to New Highs! 🚀
📉 CMP: ₹5131
🔒 Stop Loss: ₹4420
🎯 Target: ₹6383
✈️ Why IndiGo Looks Promising?
🔹 All-Time High Breakout:
IndiGo is forming a rounding bottom on the weekly chart, heading towards an all-time high breakout with a monthly and weekly close at record levels.
🔹 Strength Amid Market Correction:
While Nifty corrected due to high valuations, IndiGo showed strong resilience—a sign of relative strength and institutional confidence.
🔹 Upcoming Travel Boom:
With vacation season approaching, demand for air travel is expected to increase, potentially driving further revenue growth for IndiGo.
💡 Strategy & Risk Management:
🔒 Stop Loss: Maintain a strict stop loss at ₹4420 to protect capital against adverse moves.
📈 Staggered Entry: Given the recent market rally, a phased entry approach can help navigate volatility and enhance risk management.
⚠️ Caution: The market has seen a strong move recently—adjust your position sizing carefully to maintain an optimal risk-to-reward ratio.
📍 Outlook:
With a confirmed breakout and strong sector tailwinds, IndiGo is positioned for significant upside, making it a high-potential swing trading opportunity.
💬 Do you see aviation stocks soaring in the coming months? Drop your thoughts below!
📅 Follow for more technical insights and actionable market updates.
📈 #IndiGo #AviationStocks #BreakoutAlert #TechnicalAnalysis #SwingTrading #InvestmentOpportunities
📉 Disclaimer: As a non-SEBI registered analyst, I encourage investors to conduct independent research or consult financial professionals before making investment decisions.


INDIGO|Buy above 4575 |SL below 4400 | 1st Target 5100, 2nd 5460Disclaimer:
This is not financial advice. Please do your own research or consult with a financial advisor before making any investment decisions. Investments in stocks can be risky and may result in loss of capital.

INDIGO SHORT TERM ANALYSISIndigo is looking reasonable, and from here on, if it gives a downside, it would become a good candidate for upside in the short to medium term . An important range to watch on the downside would be 3912-2740. We can expect a trend reversal if it crosses and sustains above 4400, and it can go up to its previous highs of 4935-5050. All levels are marked in the chart posted.

for short termINDIGO AVIATION
BUYING RANGE - 4530
TARGET- 4790-5020+++
STOPLOSS 4100
Interglobe Aviation Ltd (Indigo) is India’s largest passenger airline operating as a low-cost carrier. Serving 86 destinations including 24 international destinations, it provides passengers with a simple, unbundled product, fulfilling its singular brand promise of providing “low fares, on-time flights, and a courteous and hassle-free service” to its customers. IndiGo commenced operations in August 2006 with a single aircraft and has grown its fleet to 262 aircrafts.

INDIGO SANDWITCHED BETWEEN This stock is in consolidation causes of sandwiched between support and resistances trend is obviousely bullish and can break resistance.

INDIGO S/RSupport and Resistance Levels:
Support Levels: These are price points (green line/shade) where a downward trend may be halted due to a concentration of buying interest. Imagine them as a safety net where buyers step in, preventing further decline.
Resistance Levels: Conversely, resistance levels (red line/shade) are where upward trends might stall due to increased selling interest. They act like a ceiling where sellers come in to push prices down.
Breakouts:
Bullish Breakout: When the price moves above resistance, it often indicates strong buying interest and the potential for a continued uptrend. Traders may view this as a signal to buy or hold.
Bearish Breakout: When the price falls below support, it can signal strong selling interest and the potential for a continued downtrend. Traders might see this as a cue to sell or avoid buying.
20 EMA (Exponential Moving Average):
Above 20 EMA(50 EMA): If the stock price is above the 20 EMA, it suggests a potential uptrend or bullish momentum.
Below 20 EMA: If the stock price is below the 20 EMA, it indicates a potential downtrend or bearish momentum.
Trendline: A trendline is a straight line drawn on a chart to represent the general direction of a data point set.
Uptrend Line: Drawn by connecting the lows in an upward trend. Indicates that the price is moving higher over time. Acts as a support level, where prices tend to bounce upward.
Downtrend Line: Drawn by connecting the highs in a downward trend. Indicates that the price is moving lower over time. It acts as a resistance level, where prices tend to drop.
RSI: RSI readings greater than the 70 level are overbought territory, and RSI readings lower than the 30 level are considered oversold territory.
Combining RSI with Support and Resistance:
Support Level: This is a price level where a stock tends to find buying interest, preventing it from falling further. If RSI is showing an oversold condition (below 30) and the price is near or at a strong support level, it could be a good buy signal.
Resistance Level: This is a price level where a stock tends to find selling interest, preventing it from rising further. If RSI is showing an overbought condition (above 70) and the price is near or at a strong resistance level, it could be a signal to sell or short the asset.
Disclaimer:
I am not a SEBI registered. The information provided here is for learning purposes only and should not be interpreted as financial advice. Consider the broader market context and consult with a qualified financial advisor before making investment decisions.

Indigo Bullish FlagThe chart is a 15-minute candlestick chart for InterGlobe Aviation Ltd, showing recent price movements on the NSE. The key details are:
Current Price: 4,924.80 INR, down by 7.85 INR (-0.16%).
Volume: 48.681K shares traded.
Price Range: The high was 4,934.50 INR, and the low was 4,923.45 INR.
Support and Resistance: The chart shows a resistance level around 4,998.40 INR.
Pattern: There appears to be a consolidation pattern forming, possibly a pennant or flag, suggesting potential for a breakout.
Trend: The price has been fluctuating within a range, with a recent attempt to break out upwards.
The chart suggests a potential bullish breakout if the price can surpass the resistance level. However, traders should watch for confirmation and consider volume and other indicators before making decisions.
Slightly not powerful pattern identified. check it for learning n watch it

INDIGO (Interglobe Aviation)Stock is in Bullish trend from December 2023 after it crossed 2725 level and reached 4609 which is 69% upside with in 6 months.
this stock has potential to reach 10,000 levels as this company is the largest domestic flights operator in India
Stock can be accumulated 4105 levels
Short term traders
Entry Levels - 4030 - 4150
Best support level - 4105
Stop Loss - 3870 (Strictly maintain)
First Target - 4434
other Target -4609 / 4909 / 5407
Long term investors can accumulate in dips and wait for 10,000 target in 1-2 years
Kindly consult your financial adviser before investing. this idea is for observation & education purpose only and do not recommend to trade

Indigo - Breakout AlertINTERGLOBE AVIATION LTD
Breakout of a big base in Daily timeframe.
High Trade and Delivery Quantity
Increasing Relative Strength
Within 52 week High Zone
Outperforming Sectoral Index
Disclaimer:
For educational purpose only.
Please do your own research before taking any trades.
Happy Trading!

Triangular break out in Indigo and a potential for 25 cent gain!Recent triangular break out in NSE:INDIGO on 6 months chart and the scrip trading at all time high suggests a price target of 5420 - 5480. It has recent spurt in volumes and a great ADX of more than 50.
Indigo has reported highest ever revenue of 712 Bn rupees, besides a healthy net profit margin of 11.9%. Besides this operationally too, aviation turbine fuel prices a.k.a jet fuel prices are at pre mid 2022 level.
Load factory a.k.a occupancy increased from 82% to 85% besides having a market share of ~62% and their capacity is expected to grow at 10-12% in 2025. It has ordered new 30 Airbus A350-900s in June to increase its international business to regional hubs. DIIs and FIIs have increased their share by more than 10% together in the last financial year alone i.e FY 23-24 while the promoters decreased their holding percentage. With an ROCE 0f over 25%, it is available at a PE of 23.3.
The only concern is debt to equity of 0.98, but that is to ensure expansion and purchase of aircrafts quite critical for their capacity expansion particularly in the international segment!
All the above point to a returns potential of 20-25% in the next two quarters or mostly by end of the calendar Year 2024!

Review and plan for 23rd August 2024Nifty future and banknifty future analysis and intraday plan in kannada.
stock idea- included.
This video is for information/education purpose only. you are 100% responsible for any actions you take by reading/viewing this post.
please consult your financial advisor before taking any action.
----Vinaykumar hiremath, CMT

INDIGO Price Action Analysis | Price can be touch 3940 The INDIGO price chart reveals a significant uptrend, indicating strong bullish momentum. Recent candlestick patterns show sustained buying pressure, with minimal corrections and price can be touch 3940.

INDIGO: A quick refueling is due??Okay, This one was requested by our newest follower @anurag3235
We are keeping the chart simple and self explanatory as always.
Although, One important thing to know is that the public shareholding in Indigo is mere 2%. Confused on if you should invest? We have a post that will help you make up your mind. Direct link is below:
What should we analyze next?
Have Requests, Questions, or Suggestions? DM us or comment below.👇
⚠️Disclaimer: We are not registered advisors. The views expressed here are merely personal opinions. Irrespective of the language used, Nothing mentioned here should be considered as advice or recommendation. Please consult with your financial advisors before making any investment decisions. Like everybody else, we too can be wrong at times ✌🏻

InterGlobe Aviation-1-Go long-Mide Term ViewInterGlobe Aviation: CMP:3286.80; RSI: 61.0
Script is availabel at very reasonable price. As per Elliot wave analysis the script is middle of 3rd wave pattern formation, which will strech to the first target of Rs: 3830 & final may culminate at 4246, before a wave 4 correction starts.
The mid term target is poised at upwards breakout once close above 3342 (Resistance 1) on closing basis; Second round resistance will be faced at 3468 (Resistance 2)
Target 1: 3830 (2M) ; Target 2: 4246 (2.5M)
Accumulation Zone: 3265-3240 ; Stop Loss: 3226; Suport Level : 3142 & 3016.

Bearish wedges breakdown with bearish divergence. Interglobe aviation is breaking down from a bearish wedges pattern with classic bearish divergence of Higher High and Higher Low.
Targets: 3930 / 3800

INDIGO DAILY ANALYSIS FOR POSITIONAL LONGINDIGO at major price support also with trend line support so its good for long postional stoploss below trendline for the target of upper trendline
