INDIGOPNTS trade ideas

INDIGOPNTS - Bullish view potential of 28 to 45% ROIAll details are given on chart for educational purpose only. If you like the analyses please do share it with your friends, like and follow me for more such interesting charts.
Disc - Am not a SEBI registered analyst. Please do your own analyses before taking position. Details provided on chart is only for educational purposes and not a trading recommendation

Indigo paint, Reverse Head & Shoulder pattern formedIndigo Paint formed Reverse H&S patten on Daily chart ,Break out will be above 1536 level .
Target will be 1850 .After almost 3 year ,stock also try to sustain above 200DMA (1422rs).
one can keep stop loss of 1400.
I am not Sebi registered analyst.
My studies are for educational purpose only.
Please Consult your financial advisor before trading or investing.

Midcap Paint CompanyThe company is a leading paint company in India that produces a wide range of decorative paints. It is the first company to introduce category-creator products like Metallic Emulsions, Tile Coat Emulsions, etc. in the decorative paint market in India. The company has ~80%-90% market share in some of its differentiated products.

INDIGO PAINTS Trading at all time LowGood to consider the stock for long term investment if the stock start trading above the trend line.

INDIGO immediate support 1240The stock is currently approaching a robust support level, which indicates it may be an ideal time to consider enhancing your investment position. By adding to your holdings periodically, you can take advantage of this potential uptrend for substantial long-term growth. This strategy not only capitalizes on favorable market conditions but also positions you well for future gains as the stock matures.

Indigo Paints can double in 1-2 years I think Indigo paints have good potential to marked it's hight in 12-24 months. Its low is around 900 sonthing , and it's higher low is 1200 somthing, with s.l of life time low , we can take positional trade at current price 1350 holding view 1- 2 years it can achieve to its high or 2500-2600 levels .

SWING IDEA - INDIGO PAINTSIndigo Paints , known for its innovative product offerings in the Indian paint industry, is displaying promising technical indicators for a swing trade.
Reason are listed below :
1600-1650 Resistance Zone : This significant resistance level, tested multiple times, is now possibly ready for a breakout, suggesting upward momentum.
Bullish Engulfing Candle on Weekly Timeframe : The strong bullish candle reinforces buyer interest and strength.
Breaking 2.5+ Years of Consolidation : The stock is moving out of a prolonged consolidation phase, hinting at a potential long-term trend change.
Trading Above 50 and 100 EMA on Weekly Timeframe : This indicates sustained bullish strength, with price action above critical moving averages.
Target - 1950 // 2250
Stoploss - weekly close below 1400
DISCLAIMER -
Decisions to buy, sell, hold or trade in securities, commodities and other investments involve risk and are best made based on the advice of qualified financial professionals. Any trading in securities or other investments involves a risk of substantial losses. The practice of "Day Trading" involves particularly high risks and can cause you to lose substantial sums of money. Before undertaking any trading program, you should consult a qualified financial professional. Please consider carefully whether such trading is suitable for you in light of your financial condition and ability to bear financial risks. Under no circumstances shall we be liable for any loss or damage you or anyone else incurs as a result of any trading or investment activity that you or anyone else engages in based on any information or material you receive through TradingView or our services.
@visionary.growth.insights

INDIGOPNTS NSE RBC BO SWINGINDIGOPNTS STOCK Analysis
TRADE PLAN
ENTRY -1525 50% Qty, Add 50% qty 1605 DTF Close
SL -1450
TARGET --01-1688 , TGT02--1726
Hold For a 3M or TGT 2
Chart Pattern :
STOCK is near to forming a 1Y2M RBC
INDICATORS EMA :
The Price is Currently Trading above 50EMA, and 20EMa below 50EMA in DTF. STOCK EMAs are currently in alignment where today an 4.8%+ price rise with Volumes indicating start of a bullish Trend on DTF/WTF.
FIBO/E :
Currently the price is below 23.6% FIBO Retracement Level, Early Entry can be take as per your risk ability. Safe Traders Enter above 1525.
Volumes: The volumes currently are not very exciting though above the 20VMA on lower Time Frame
Keep in your Priority Watch List
Disclaimer: For Education/Reference Purpose Only, Trade at your Own Risk with correct position sizing and SL based on your Risk appetite (Exit when price closes 7to8% below your Entry) and re enter when trend reverses...
Trail Your SL progressively. Learn/Know and Review the Stock trading Technical Terminology. Check Verify the Financial fundamentals of the Stock and Seek Advice from a Certified Financial Advisor prior to Investing. Prefer Entry with 25% quantity, Add in Tranches of 25%-50% as prices moves upwards recommended.
MTFA- Multiple Time Frame Analysis
DTF -Daily Time Frame
WTF-Weekly Time Frame
MTF- Monthly Time Frame
ATH-All Time High
LTH -LifeTime High
RBC&H-Rounding Bottom Cup/Handle
BO- Breakout Close
EMA -Exponential Moving Average
FIBO R/E -Trend based Fibonacci Retracement/Extension
SL Stop Loss
TBD- To be Decided
CHoCH- Change of Character Bullish/Bearish
MSB/BOS -Break Out Structure
FVG Fair Value Gap
20VMA -20Volume Moving Average
SWING/POSITIONAL Trade

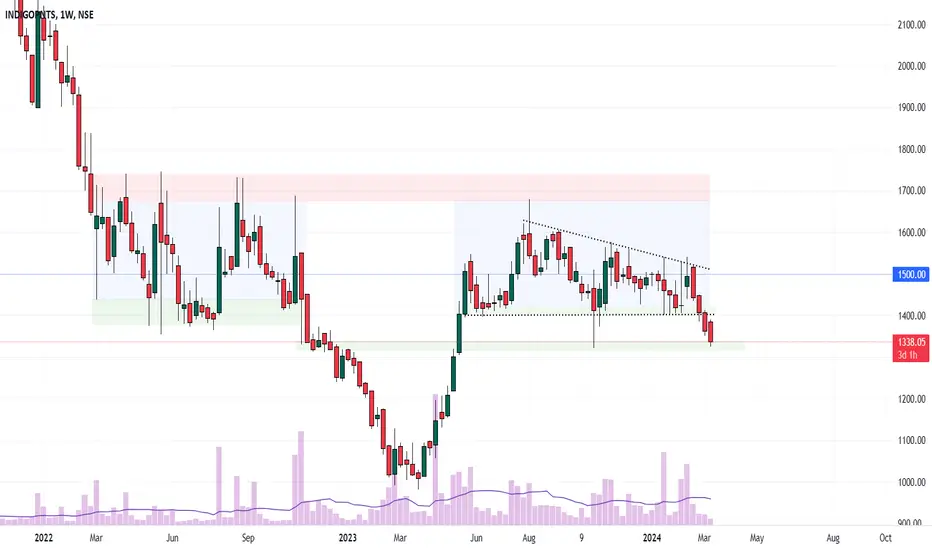
Are the volumes painting a picture in INDIGOPNTS ?The price action and the volumes seem to be painting a LONG picture for Indigo Paints scrip. Read on further on the chart to find the factors that make this chart an attractive one a this point. It would be interesting to see if the chart is promising a revisit to its ATH (all-time high) prices.

SWING IDEA - INDIGOPNTSWhile Price Action has changed course with the previous MACD Cross. Let's hope the new MACD cross can also take the price to the next leg up.
Price is also currently its Support/Resistance zone.
Let's see how things playout.
Another point to note: Recent Q4 earnings have reported decent profits too.

INDIGO PAINTS S/R Support and Resistance Levels:
Support Levels: These are price points (green line/shade) where a downward trend may be halted due to a concentration of buying interest. Imagine them as a safety net where buyers step in, preventing further decline.
Resistance Levels: Conversely, resistance levels (red line/shade) are where upward trends might stall due to increased selling interest. They act like a ceiling where sellers come in to push prices down.
Breakouts:
Bullish Breakout: When the price moves above resistance, it often indicates strong buying interest and the potential for a continued uptrend. Traders may view this as a signal to buy or hold.
Bearish Breakout: When the price falls below support, it can signal strong selling interest and the potential for a continued downtrend. Traders might see this as a cue to sell or avoid buying.
20 EMA (Exponential Moving Average):
Above 20 EMA(50 EMA): If the stock price is above the 20 EMA, it suggests a potential uptrend or bullish momentum.
Below 20 EMA: If the stock price is below the 20 EMA, it indicates a potential downtrend or bearish momentum.
Trendline: A trendline is a straight line drawn on a chart to represent the general direction of a data point set.
Uptrend Line: Drawn by connecting the lows in an upward trend. Indicates that the price is moving higher over time. Acts as a support level, where prices tend to bounce upward.
Downtrend Line: Drawn by connecting the highs in a downward trend. Indicates that the price is moving lower over time. It acts as a resistance level, where prices tend to drop.
RSI: RSI readings greater than the 70 level are overbought territory, and RSI readings lower than the 30 level are considered oversold territory.
Combining RSI with Support and Resistance:
Support Level: This is a price level where a stock tends to find buying interest, preventing it from falling further. If RSI is showing an oversold condition (below 30) and the price is near or at a strong support level, it could be a good buy signal.
Resistance Level: This is a price level where a stock tends to find selling interest, preventing it from rising further. If RSI is showing an overbought condition (above 70) and the price is near or at a strong resistance level, it could be a signal to sell or short the asset.
Disclaimer:
I am not a SEBI registered. The information provided here is for learning purposes only and should not be interpreted as financial advice. Consider the broader market context and consult with a qualified financial advisor before making investment decisions.

Indigo Paints Near Bullish Breakout Zone➡️ Bullish breakout observed near ₹1,525.55
➡️ Resistance at ₹1,584.65, supported by ascending trend line

Head & shoulder breakouthead & shoulder breakout
neckline comes at 1490
breakout above neckline gives target of 2400

INDIGOPNTS LongExpecting big volumes, if does not happen in a week, will be downsizing 50% of the position.

Indigo paints getting accumulatedIndigo paints can double from here with in few years. Sl below the trend line.
Chart is self explanatory. Please follow the price action & take the trade as per your appetite.
The information provided here is only for educational purpose. The information provided here is not intended to be any kind of financial advice, investment advice, and trading advice. Investment in stock market is very risky and trading stocks, options and other securities involve risk. The risk of loss in stock market can be substantial. Moreover, I am not a SEBI registered analyst, so before taking any decision or before investing in any Share consult your financial advisor and also do your analysis and research.
Request your support and engagement by liking and commenting & follow to provide encouragement.

INDIGOPNTS - Long above 1500Can go long above 1500
In consolidation for last 2 years and inverse head & shoulder pattern in weekly timeframe. Please wait for good candle close above 1500.
Stoploss - Mentioned in the Chart.
Target - TP1 and TP2 mentioned in the chart.

Indigo paints is making the base & ready to flyIndigo paints can double from here with in few years. Sl below the trend line.
Chart is self explanatory. Please follow the price action & take the trade as per your appetite.
The information provided here is only for educational purpose. The information provided here is not intended to be any kind of financial advice, investment advice, and trading advice. Investment in stock market is very risky and trading stocks, options and other securities involve risk. The risk of loss in stock market can be substantial. Moreover, I am not a SEBI registered analyst, so before taking any decision or before investing in any Share consult your financial advisor and also do your analysis and research.
Request your support and engagement by liking and commenting & follow to provide encouragement.

Pole and flag breakoutPole and flag breakout.....potential upside Target 2076.....stop loss below 1358.50 closing basis...Not any recommendation....only for educational purpose....

INDIGO PAINTSINDIGO PAINTS IS NOW S TRIANGLE PATTERN. stock VALUE is good.
excellent RETURNS and good PROFIT growth. DEBT free company.
*3M volume = excellent
* previous = low trend
* PATTERN = breakout
SET STOP LOSS & PROFIT
MY ACTION ;
I AM BUY TOMORROW AFTER ANALYSIS.
SEE COMMENTS

INDIGO PAINTS - What's in store!🎯The chart is pretty self-explanatory as always!
🎯Will we reverse or continue the downfall??
Share your thoughts below !
⚠️Disclaimer: We are not registered advisors. The views expressed here are merely personal opinions. Irrespective of the language used, Nothing mentioned here should be considered as advice or recommendation. Please consult with your financial advisors before making any investment decisions. Like everybody else, we too can be wrong at times ✌🏻

Inverse Head & Shoulder Chart Pattern under ConstructionAn inverted head and shoulder pattern forms a bullish reversal pattern after a downtrend. It consists of three consecutive troughs, with the middle trough, known as the head, being the lowest, and the other two troughs, known as the shoulders, forming higher lows. The pattern resembles a head with two shoulders, hence its name.
Traders interpret the inverted head and shoulders pattern as a sign that the bearish momentum is weakening and a potential trend reversal is imminent. It suggests that buyers are gaining strength, and the price will likely move upward after the pattern completes.
