INDRAMEDCO trade ideas

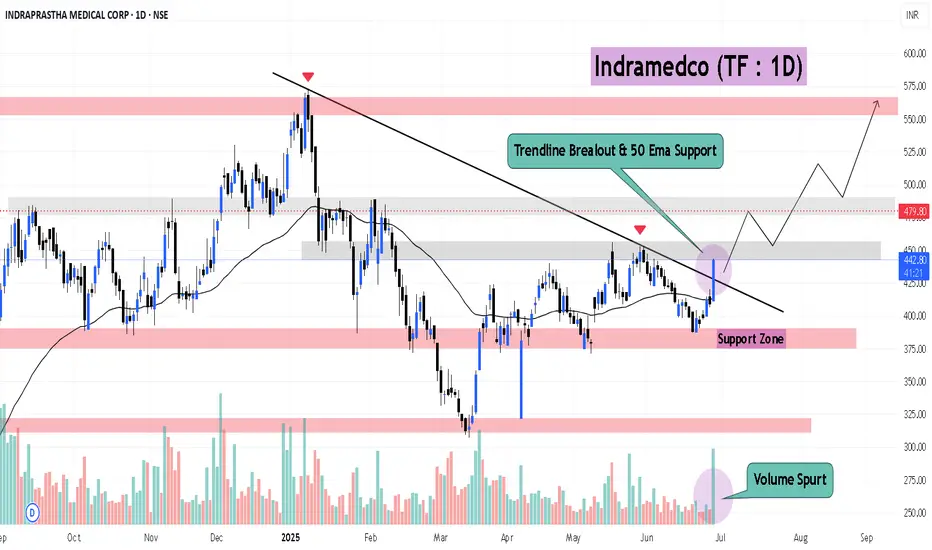
Strong #BreakoutStock : INDRAMEDCOStrong #BreakoutStock : INDRAMEDCO📈
- Trendline Breakout following 50 ema support
- Volume Spurt
- Steady rising Volume
📌Potential upside 📈
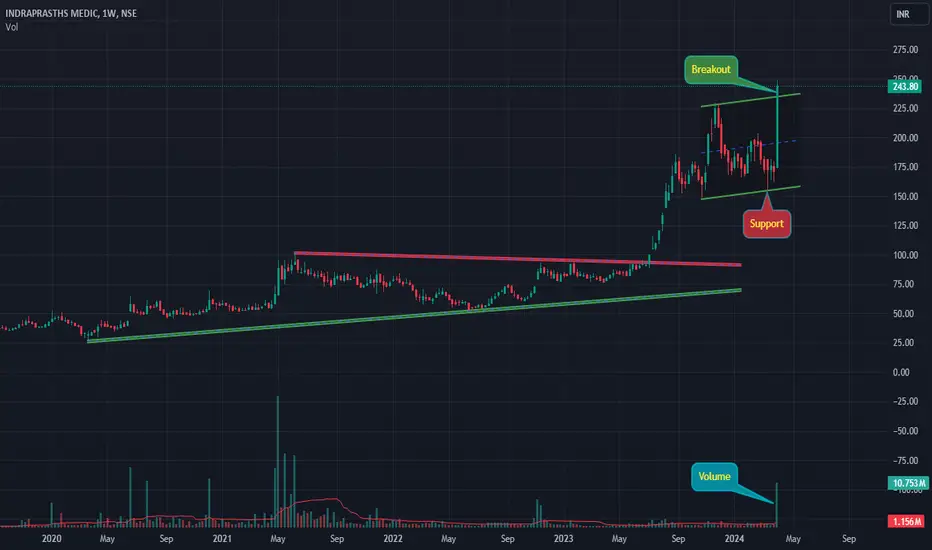
Indramedco - Rectangle BreakoutIndraprastha Medical Corporation Ltd.
Bullish Rectangle Breakout.
Higher Trade Quantity.
Within 52 Week Zone.
Close above last week high.
Outperforming Stock.
Disclaimer:
For educational purpose only.
Please do your own research before taking any trades.
Happy Trading!

Darvas Box Strategy - Break out Stock - Swing TradeDisclaimer: I am Not SEBI Registered adviser, please take advise from your financial adviser before investing in any stocks. Idea here shared is for education purpose only.
Stock has given break out. Buy above high. Keep this stock in watch list.
Buy above the High and do not forget to keep stop loss, best suitable for swing trading.
Target and Stop loss Shown on Chart. Risk to Reward Ratio/ Target Ratio 1:1
Stop loss can be Trail when it make new box / Swing.
Be Discipline, because discipline is the key to Success in Stock Market.
Trade what you See Not what you Think.

Retest after BreakoutA value stock in a continuous uptrend giving another opportunity to enter.
Double Digit ROE and ROCE
Stock PE < Industry PE
EPS contiguously rising
FII stake continuously increasing.
DII stake continuously increasing.
Technical: Retesting after breakout.

Darvas Box Strategy - Break out Stock - Swing TradeDisclaimer: I am Not SEBI Registered adviser, please take advise from your financial adviser before investing in any stocks. Idea here shared is for education purpose only.
Stock has given break out. Buy above high. Keep this stock in watch list.
Buy above the High and do not forget to keep stop loss, best suitable for swing trading.
Target and Stop loss Shown on Chart. Risk to Reward Ratio/ Target Ratio 1:1
Stop loss can be Trail when it make new box / Swing.
Be Discipline, because discipline is the key to Success in Stock Market.
Trade what you See Not what you Think.

Consolidation breakout 600+ posible
Indraprastha Medical Corp (4H Chart Analysis)
Current Price: ₹504.90
---
Key Levels:
Support Zones: ₹450 | ₹392
Resistance Zone: ₹520
---
Pattern Explanation:
Rectangle Consolidation Breakout:
Chart par ek rectangle consolidation ka pattern clear dikh raha hai, jisme price ne ₹450 aur ₹520 ke beech kaafi time tak move kiya.
Ab price ₹520 ke upar breakout kar raha hai, jo bullish signal hai.
Breakout ke baad price uptrend me ja sakta hai, aur ₹560 aur ₹600 ke levels ko target kar sakta hai.
Higher Highs and Higher Lows:
Price consistently higher highs aur higher lows bana raha hai, jo strong uptrend ko indicate karta hai.
200 EMA Support:
Price 200 EMA ke upar trade kar raha hai, jo ek long-term bullish sentiment dikhata hai.
---
Volume Analysis:
Breakout ke time par volume me surge aaya hai, jo confirm karta hai ki ye breakout genuine hai.
---
Trade Setup:
Entry: ₹520 ke upar breakout confirm hone par.
Stop Loss: ₹450 ke neeche (rectangle ke lower boundary ke neeche).
Target 1: ₹560
Target 2: ₹600
---
Risk-Reward:
Risk-reward ratio favorable hai, agar price rectangle consolidation ke breakout ke baad momentum maintain kare.
---
Conclusion:
Rectangle Pattern Breakout aur 200 EMA support ke saath, ye stock short-to-medium term ke liye bullish lag raha hai. Entry lene se pehle ₹520 ke upar closing aur volume ka confirmation dekhna zaroori hai.
---
Note: Analysis technical basis par hai. Market conditions aur risk appetite ke hisaab se position manage karein.

Indraprastha MedicalBigg opportunity, targets high. 900 ++++
Holdings increased in September buy FII and DII and Government too. Somethings ONNNN

50 SMA Rising - Swing TradeDisclaimer: I am not a Sebi registered adviser.
This Idea is publish purely for educational purpose only before investing in any stocks please take advise from your financial adviser.
50 SMA Rising strategy. Suitable for Swing Trading Initial Stop loss lowest of last 2 candles and keep trailing with 30 days SMA if price close below 30 SMA then Exit or be in the trade for 2 to 4 weeks.
Target & Stop loss shown on Chart. Do not Forget to Exit if Stop loss Hit.
Be Discipline because discipline is the Key to Success in the STOCK Market.

Inderparasth Medical longInderparast Medical Daily Demand 465
Inderparast Medical 240 Demand 465
All Trend Upside
Target 600

Indramedco - Increasing MomentumIndraprastha Medical Corporation Ltd.
Crossing All Time High
Increasing Relative Strength
High Volume & Delivery
Disclaimer:
For educational purpose only.
Please do your own research before taking any trades.
Happy Trading!

INDRAMEDCO - BULLISH SETUPStock name = Indraprastha Medical Corprration Limited.
Weekly chart setup
Chart is self explanatory. Levels of breakout, possible up-moves (where stock may find resistances) and support (close below which, setup will be invalidated) are clearly defined.
Master Score - B
Disclaimer: This is for demonstration and educational purpose only. this is not buying and selling recommendations. I am not SEBI registered. please consult your financial advisor before taking any trade.
INDRAPRASTHA MEDICAL CORP - A good reversal bet for 15% ROI.The stock has given a fantastic rally , yearly breakout of 22 years in 2023.
The stock has been taking strong support at 165 levels since 4 months.
Now it shows reversal from 165 levels. Confirmed by price action - RSI.
Entry - 194.
Targets - 204, 208, 216,225.
It would be great to trail the profits once 225 is taken off.
To note : Quarterly results are good. Also DIIs have started purchasing the stock since last 2 quarters, new addition. FIIs have marginally increased stake.

Regular Flat : Elliott Wave Correction Regular Flat : Elliott Wave Correction
Identified By student which shows the complete formation of Elliott wave flat correction
which is following basic the rule of subdivision of wave as 335 .
Although Find the basic rule for flat correction for your prectice :
REGULAR FLAT :
1- A Corrective 3 waves move labelled as ABC
2- Subdivision of wave A and B is in 3 waves
3- Subdivision of wave C is in 5 waves impulse / diagonal
4- Wave B Terminates about the beginning of Wave A
5- Wave C Can Terminate Till End Point of Wave A
6- Subdivision of wave A and B can be in any corrective 3 waves structure including zigzag, flat, double three, triple three

Chart of the weakIndraprastha medical
1)considering weakly chart.
2) runaway gap at two area one at 73 level and another one at 100
3) Cup with handle pattern also breakout at level of 100
4) huge potential to give great return
5) take Stop loss of 99 and move ahead of 60+ upside
*No recommendation for buy or sell*

Indraprastha MedicoMulti year BO of a microcap stock that is related to medical industry where pharma sector also started showing the reversal signs.
Positives:
Long term trendline breakout
Gann box level breakout
RSI above 65
MACD showing strength

BUY INDRAPRASTHA MEDICOBuy above 85
Sell at 95 103
Exit below 77 on daily closing basis
Book profits accordingly.


INDRAMEDCONSE:INDRAMEDCO
Please note that we are not a SEBI Registered Investor Adviser/PMS/ Broking House.
All the contents over here are for educational purposes only and are not investment advice or recommendations
offered to any person(s) with respect to the purchase or sale of the stocks / futures and options.
You are also requested to apply your prudence and consult your advisers in case you choose to act on
any such content available as WE claims no responsibilities for any of your actions or any outcome of
such action

Indraprastha Medical Formed Bull Flag Pattern in last 2 years. Right now in Descending Traingle pattern, which is bearish. If it breaks bottom trend line, it will be major downside. For trend reversal, need to breakout upper trendline with 3-4 above the line.

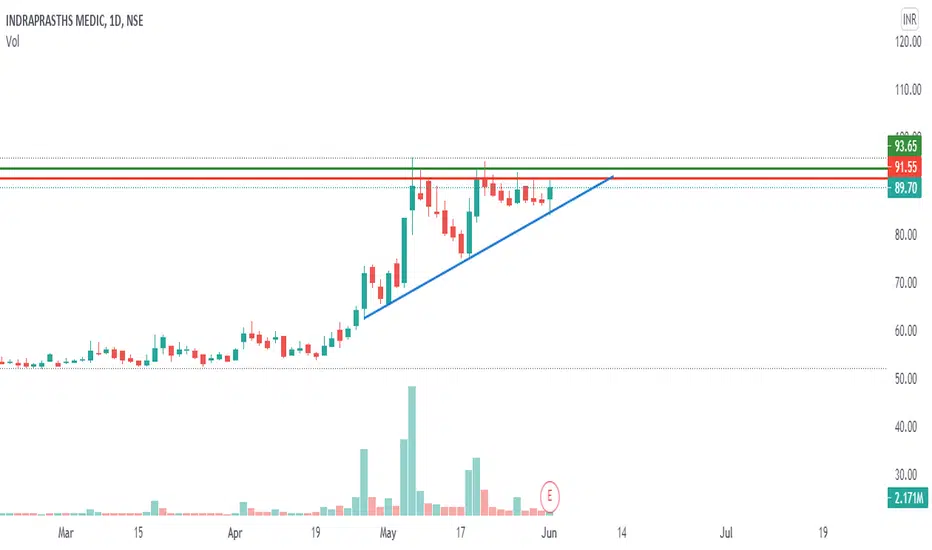
Buying oppprtunity in indramedcoNSE:INDRAMEDCO
There is a asceding triangle and the trend is trending higher and the mometum is also trending higher u can either buy at a retracement to the trend line or breakout above the resistance scale out at 1:2 risk reward or just hang on till the trade loses mometum use the 12 period mometum indicator as a histogram and sell it as 3 successive lows of momentum.This is a swing trade that could last till a month and it depends on how well it performs

INDRAMEDCO - ASCENDING TRIANGLE - AWAITING BREAKOUT?JOIN US IN YOUTUBE FOR POTENTIAL BREAKOUT STOCKS DAILY/WEEKLY/MONTHLY
YOUTUBE CHANNEL : BREAKOUT WITH SAM PRASANNA