Indusind bank - Bullish setupIndusind bank - Bullish setup - expect the stock to hit the parallel and then stall for some time before it moves higher
INDUSINDBK trade ideas

IndusInd Bank BuyIndusInd Bank taking support and making range at trend line. Buy @CMP (860) with SL of 800 and target of 950 and 1050.

Right time to short INDUSIND BANKGetting rejected from price level of 820.
next support level only at 673/670.
With stoploss at 822, a good chance to short it.
Poor earnings report and many fradulent insider trading makes sense to short.

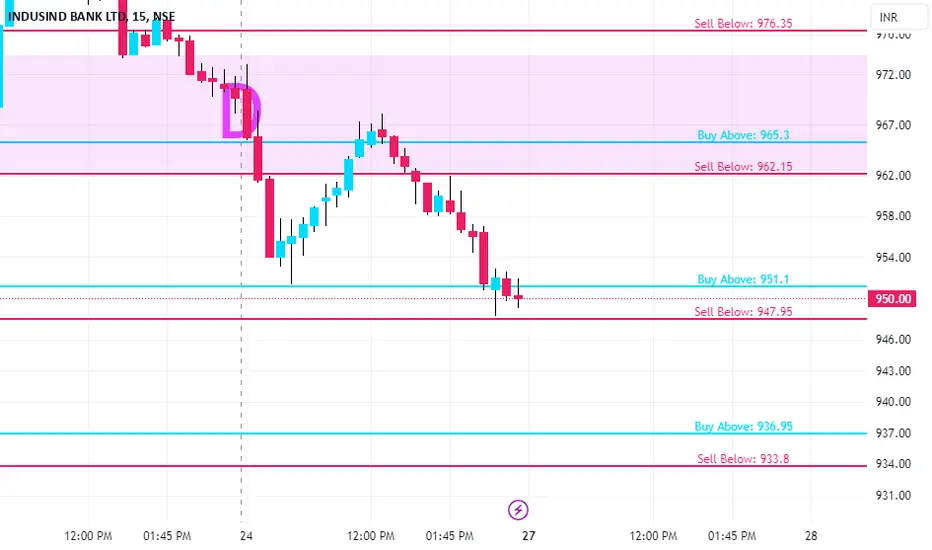
Indusnd Bank Ltd view for Intraday 27th May #INDUSINDBK Indusnd Bank Ltd view for Intraday 27th May #INDUSINDBK
Resistance 805 Watching above 807 for upside momentum.
Support area 790 Below 800 ignoring upside momentum for intraday
Watching below 788 for downside movement...
Above 800 ignoring downside move for intraday
Charts for Educational purposes only.
Please follow strict stop loss and risk reward if you follow the level.
Thanks,
V Trade Point

Cummins India Ltd view for Intraday 26th May #CUMMINSIND Cummins India Ltd view for Intraday 26th May #CUMMINSIND
Resistance 2965 Watching above 2970 for upside momentum.
Support area 2900 Below 2930 ignoring upside momentum for intraday
Watching below 2892 for downside movement...
Above 2930 ignoring downside move for intraday
Charts for Educational purposes only.
Please follow strict stop loss and risk reward if you follow the level.
Thanks,
V Trade Point

Indusnd Bank Ltd view for Intraday 26th May #INDUSINDBK Indusnd Bank Ltd view for Intraday 26th May #INDUSINDBK
Resistance 800 Watching above 802 for upside momentum.
Support area 785 Below 795 ignoring upside momentum for intraday
Watching below 784 for downside movement...
Above 795 ignoring downside move for intraday
Charts for Educational purposes only.
Please follow strict stop loss and risk reward if you follow the level.
Thanks,
V Trade Point

DLF WEEKLY BREAK OUT WITH CONFIRMATION
After months of consolidation and a healthy correction, **DLF Ltd** is showing strong signs of **trend resumption**.
### 📊 Technical Highlights:
* ✅ **8.46% weekly gain** with strong bullish candle and volume.
* ✅ **Bounce from the 200-week EMA** (red line), a classic long-term support zone.
* ✅ Price is reclaiming the **20-week EMA** (blue line) after a multi-week downtrend — often an early signal of reversal.
* 🔁 **Higher low formation** visible on the weekly timeframe.
* 🔼 Looks poised for a fresh uptrend if follow-through buying comes in.
### 📌 Key Levels:
* **Resistance**: ₹820–₹850 (short-term supply zone)
* **Support**: ₹720–₹740 zone
* **Breakout Confirmation**: Above ₹800 with volume
* **Targets (Mid-term)**: ₹890 / ₹950 / ₹1020
### 🧠 Trading Plan:
* **Swing Traders**: Can consider entries near ₹750–₹765 with SL below ₹715.
* **Investors**: Ideal accumulation zone with long-term support in place and trend resumption setup forming.
### ⚠️ Risk Management:
* Always follow a stop-loss strategy.
* Position sizing according to portfolio risk tolerance.
This idea is for educational and informational purposes only. Always do your own research and consult with a financial advisor before trading or investing

Indusnd Bank Ltd view for Intraday 23rd May #INDUSINDBK Indusnd Bank Ltd view for Intraday 23rd May #INDUSINDBK
Resistance 790 Watching above 792 for upside momentum.
Support area 775 Below 785 ignoring upside momentum for intraday
Watching below 776 for downside movement...
Above 785 ignoring downside move for intraday
Charts for Educational purposes only.
Please follow strict stop loss and risk reward if you follow the level.
Thanks,
V Trade Point

Indusind Bank Ltd Is Around Long-Term SupportAfter a big drop and several sharp price swings in Indusind Bank Ltd stock, it's now near a strong long-term support level. A patterns, an Opening Wedge, can be seen on the charts. It looks like a good opportunity to add on a bad day. The Volume Profile also suggests a good accumulation Zone.

Indusind Bank post result# Result was terrible from all angles but markets are forward looking. More than 4000 crores oneoff. If one adds that PBT moves to 7500 crores which will not look that bad considering the valuation of less than 1 time fy 26 book value.
# Entire media has turned cautious and brokerages have slashed price targets left right and center but to me the price action if you look at closing chart is not negative. In fact I would say all kinds of rumors and bad news of losses were thrown at the bank but the stock refuses to close below 750.
# This is how stocks bottom and move up contrary to what market participants in general say. They say what they just saw but market works differently. The price action to me, and I could be wrong, is very bullish and i will not be surprised if in next 12 months the stock trades above 1200.

Indusnd Bank Ltd view for Intraday 22nd May #INDUSINDBK Indusnd Bank Ltd view for Intraday 22nd May #INDUSINDBK
Resistance 780 Watching above 783 for upside momentum.
Support area 760 Below 770 ignoring upside momentum for intraday
Watching below 757 for downside movement...
Above 770 ignoring downside move for intraday
Charts for Educational purposes only.
Please follow strict stop loss and risk reward if you follow the level.
Thanks,
V Trade Point

Review and plan for 16th May 2025 Nifty future and banknifty future analysis and intraday plan.
Quarterly results.
This video is for information/education purpose only. you are 100% responsible for any actions you take by reading/viewing this post.
please consult your financial advisor before taking any action.
----Vinaykumar hiremath, CMT

IndusIndBk is in bearish zoneIndusIndBk is into bearish zone, my custom indicator generated sell "Becho" signal at 824.05 and it was dropped till 805 and rise again. Lets see how much it will drop.
Note: This is not a buy/sell call, Use stop loss too.

INDUSIND BANK LTD S/RSupport and Resistance Levels:
Support Levels: These are price points (green line/shade) where a downward trend may be halted due to a concentration of buying interest. Imagine them as a safety net where buyers step in, preventing further decline.
Resistance Levels: Conversely, resistance levels (red line/shade) are where upward trends might stall due to increased selling interest. They act like a ceiling where sellers come in to push prices down.
Breakouts:
Bullish Breakout: When the price moves above resistance, it often indicates strong buying interest and the potential for a continued uptrend. Traders may view this as a signal to buy or hold.
Bearish Breakout: When the price falls below support, it can signal strong selling interest and the potential for a continued downtrend. Traders might see this as a cue to sell or avoid buying.
MA Ribbon (EMA 20, EMA 50, EMA 100, EMA 200) :
Above EMA: If the stock price is above the EMA, it suggests a potential uptrend or bullish momentum.
Below EMA: If the stock price is below the EMA, it indicates a potential downtrend or bearish momentum.
Trendline: A trendline is a straight line drawn on a chart to represent the general direction of a data point set.
Uptrend Line: Drawn by connecting the lows in an upward trend. Indicates that the price is moving higher over time. Acts as a support level, where prices tend to bounce upward.
Downtrend Line: Drawn by connecting the highs in a downward trend. Indicates that the price is moving lower over time. It acts as a resistance level, where prices tend to drop.
Disclaimer:
I am not a SEBI registered. The information provided here is for learning purposes only and should not be interpreted as financial advice. Consider the broader market context and consult with a qualified financial advisor before making investment decisions.

Indusind Bank: Is this a rare buying opportunity?Once in a decade kind of opportunity at 690 odd levels as on 19th March 2025 in my view.
Stock over reacted to the derivative accounting issue worth 2.35% of Networth
The stock is available at 0.7 time fy 26 book value which is just a year from now.
With GNPA at 2.5%, NNPA at 1%, CAR of 16% and a quarterly profit potential of 2500 crores on a b/s size of 6 lac crores, 1500 crores of expected loss is easily absorbable and a 27% reaction on 11th March for that was blown out of proportion.
I am aware that ceo got only 1 year extension when board approved 3 years and there is a sudden discrepancy of 1520 crore which has come out of blue due to derivative hedging issue but we have seen such events in past and the valuation didn't breakdown to such ridiculous levels.
For example ICICI Bank faced issues of CEO fraud, excessive lending to troubled corporates and yet it bottomed out at 1.2 times book Value.
Another example is of Axis Bank when RBI found NPA divergence of 5600 crores worth over 10% of its networth at that time in June 2017. The stock fell only 9% that day and didn't went below 1.8 times book value. CEO sikha sharma didn't got any extension even though board approved 3 years of extension to her as CEO.
Even in the biggest banking fraud which involved Well Fargo having opened millions of fake accounts, the stock fell only 20% from top to bottom and recovered the lost ground in next 5 months.
The reason that I can imagine why IndusInd bank has reacted so violently is due to enormous amount of technical / momentum traders and strategies at play in market these days. Algo based trading coupled with leverage has created a scenario where even a slightest news is creating a monster reaction on downside when everyone is trying to exit at the same time. That is creating the price distortion I have not witnessed before.
Once things settle the market will revalue the bank appropriately and in a years time it should be above 1650 levels valuing it at 1.5 time fY 27 book value.
Note: I am invested in the stock and if you wish to buy this investment please consult your financial advisor and follow a diversified portfolio approach.


Indusind Bank: A Massive opportunity in my view# Once in a decade kind of opportunity at 680 odd levels as on 17th March 2025
# Stock over reacted to the derivative accounting issue worth 2.35% of Networth
# The stock is available at 0.7 time fy 26 book value which is just a year from now.
# With GNPA at 2.5%, NNPA at 1%, CAR of 16% and a quarterly profit potential of 2500 crores on a b/s size of 6 lac crores, 1500 crores of expected loss is easily absorbable and a 27% reaction on 11th March for that was blown out of proportion.
# I am aware that ceo got only 1 year extension when board approved 3 years and there is a sudden discrepancy of 1520 crore which has come out of blue due to derivative hedging issue but we have seen such events in past and the valuation didn't breakdown to such ridiculous levels.
# For example ICICI Bank faced issues of CEO fraud, excessive lending to troubled corporates and yet it bottomed out at 1.2 times book Value.
# Another example is of Axis Bank when RBI found NPA divergence of 5600 crores worth over 10% of its networth at that time in June 2017. The stock fell only 9% that day and didn't went below 1.8 times book value. CEO sikha sharma didn't got any extension even though board approved 3 years of extension to her as CEO.
# The reason that I can imagine why IndusInd bank has reacted so violently is due to enormous amount of technical / momentum traders and strategies at play in market these days. Algo based trading coupled with leverage has created a scenario where even a slightest news is creating a monster reaction on downside when everyone is trying to exit at the same time. That is creating the price distortion I have not witnessed before.
# Once things settle the market will revalue the bank appropriately and in a years time it should be above 1650 levels valuing it at 1.5 time fy 27 book value.

IndusInd Bank Cypher / Shark formation-Can take it to 550 / 410On a Monthly time frame,
IndusInd Bank has shown Cypher / Shark formation.
Any monthly candle close below 780 will open gate for following targets,
780 / 650 / 550 / 410

Indusind Bank Investment Oppurtunity After a crazy fall since Sept 2024 and the stock has nearly corrected about 75 % and now its tiME TO long it .
BUY-1045
Targets: 1083,1245,1445,1560,1700

INDUSINDBK KEY LEVEL FOR 17/02/2025//description
// All credit goes to Tony for the concept of this indicator. His Trading View link: www.tradingview.com
// Note: The calculation method in this indicator differs from Tony's, but the concept is derived from his work.
I want to make it clear that I am not a seller, and this method was not taught to me by anyone. The original creator only gave me one clue:
👉 "If you get one level, you get all levels."
Everything else—the way I nail it the method and applied it—is my own work. I respect the original idea, but my approach is independent.
Explanation:
This trading system helps you avoid blind trades by providing confirmation for better entries and exits.
Entry/Exit Points:
- Entry/Exit Lines: Use the BLACK line for long trades and the RED line for short trades, based on confirmation from your trading plan.
- Stop Loss: For long trades, set the stop loss at the RED line below. For short trades, set it at the BLACK line above.
- Take Profit: For long trades, target the next RED line above. For short trades, target the next BLACK line below.
Timeframe:
Use a 5 mins timeframe for trading.
Risk Disclaimer:
This setup is for educational purposes. I'm not responsible for your gains or losses. Check the chart for more details.

Levels to watch out I’ve been long on the market around the 960 mark and plan to hold for the long term, expecting it to eventually surpass previous highs in the coming months.
The RBI’s recent decision to cut interest rates for the first time in 5 years signals a move to stimulate economic activity. It seems they’ve waited too long, though, and it may have been a bit late.
Interest rate cuts are typically aimed at driving economic growth, especially during periods of slow growth or potential recession. While such moves are often positive for stocks in the short term—due to the stimulation of the economy, cheaper borrowing costs, and more investment in riskier assets—there’s still uncertainty about where the markets will head, especially as we may be on the brink of a major economic slowdown.
At the moment, I am short on Nifty and cautious about adding long positions to Nifty 50 stocks. I’m building my portfolio gradually rather than going all in at this point.
As for IndusInd, it has undergone a solid correction, making it a good opportunity to accumulate at these levels. The market could potentially dip further, reaching levels around 789 or 545, making it a good time to build positions.

Indusind Bank Bottoms Reversal confirmed in seeing a good upside Can see 10 % upside and if sustain above 1100 then we can see new rally.
This post is just my perception and for study purpose only.
I am not a SEBI registered analyst. As stock market has risk of loosing money.
Please invest your hard earned money carefully.
I will not be responsible for any loss in the stock market.

INDUSINDBK KEY LEVELS FOR 27/01/2025**Explanation:**
This trading system helps you avoid blind trades by providing confirmation for better entries and exits.
**Entry/Exit Points:**
- **Entry/Exit Lines:** Use the BLACK line for long trades and the RED line for short trades, based on confirmation from your trading plan.
- **Stop Loss:** For long trades, set the stop loss at the RED line below. For short trades, set it at the BLACK line above.
- **Take Profit:** For long trades, target the next RED line above. For short trades, target the next BLACK line below.
**Timeframe:**
Use a 5 timeframe for trading.
**Risk Disclaimer:**
This setup is for educational purposes. I'm not responsible for your gains or losses. Check the chart for more details.