INDUSINDBK trade ideas

INDUSINDBK LongNSE:INDUSINDBK is a great time to enter the market, whether it be a short term or long.


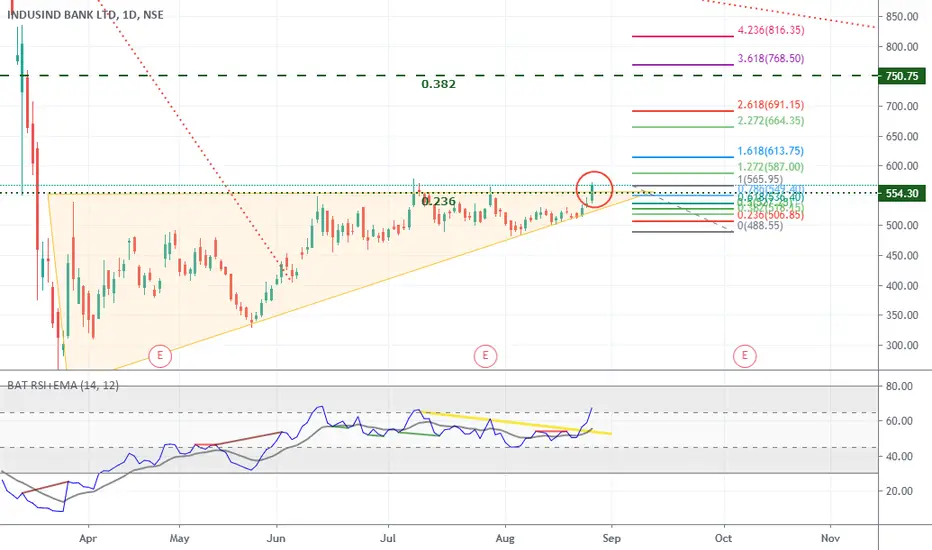
INDUSIND bank triangular breakout indusind is clearly broke the triangle set up. It made the retest also.
So all the drama is gone.
Remember in the current bull, banks did not participate the rally.
This time for banks.
Your humble trader
Kiran

INDUS BANK - RECOVERY MODEPlease calculate the Price Target yourself according to the Arrows shown on the chart 😎.
Professional Day/ Short-Term Swing Trader. Ideas and entities are opinions. Trade at YOUR OWN RISK. I am not your financial advisors. Risk it for the biscuit.

Indus Bank - V - Shape recovery Incoming, 1 Sep 20.In the morning of 31 Aug, the Global cues were positive, So the geological development looks like to be the major reason that has triggered the negative impulse in the market. The beers took advantage of the situation and this action has also triggered Panic Selling in the market. Profit Booking due to month end added fuel to the situation.
I am still positive that this may gap up at the opening at 641. If this does not open gap up , In the first 1 Hr people will start booking their profit due to the situation not clear plus bears will also be active. At around 11;0 0 - 1:30 market may move towards to a "V" shape recovery due to the fact that despite of the situation on 31 Aug, there was buying pressure towards the end of the day.
Bullish Hammer (H) is noticed on the last 1Hr chart of trading. Still bullish for the targets mentioned in my earlier post of 29 Aug. Hold tight !
Disclaimer:
Professional Day/ Short-Term Swing Trader. Ideas and entities are opinions. Trade at YOUR OWN RISK. I am not your financial advisors. Risk it for the biscuit.

INDUSIND BANKSimple chart based on price action. A parallel channel within another channel.
Breakout from the inside channel.
*****
Help Me to Help Us.
I believe in keeping the chart simple with minimal drawings & easy to interpret.
So kindly express any disagreement & improvements so that we learn & earn together.
Please support the effort and appreciate it with a Like if you felt it deserves it and Following me would only add on to the motivation.


IndusInd Bank Ltd - WEEKLY CHART VIEW!!#INDUSINDBK
IndusInd Bank Ltd.
Anticipated Bounce back above 530 helped the price to add fresh positive strength and demand to fly high.
As of now 670 - 690 - 700 should consider as resistance and 625 - 600- 580 as support.
Fresh upside above 700 expecting to increase bullish sense further .


INDUSINDBANK Go Long Indusindbank : fresh breakout with good volume confirmation , go long for target 794 with sl 542.


INdusind BankVery big Breakout ...taken it higher.... always trade when u see reversal at given PRZ ....


INDUSIND Consolidation Breakout is likely - Watch itINDUSIND is consolidating between 480-570 levels on daily charts for the last 2 months, BANKNIFTY also looks bullish, continued momentum in BANKNIFTY and if price sustains above 570, it will easily reach 740 levels. in the last few sessions, every fall it is traded with low volume, indicating accumulation. 560-570 level is already tested, so if it breaks it can quickly jump to 700 levels.


INDUSIND BANK : 27 AUG 20 :569 IS THE MAJOR RESISTANCE AREA. LETS SEE WHETHER IS IT ACT AS SUPPORT AREA OR RESISTANCE AREA.
SEE ALL MY CHARTS IF THEY ARE A KNOWLEDGE SEEKERS OPPORTUNITIES THEN LIKE MY CHARTS BECAUSE THEY ONLY ARE THE MOTIVATION FOR KNOWLEDGE HUNTERS.

