SYSTEM FAAD DENGEYes, IndusindBank Fut system faad dega.
Indusind Bank Fut is trading inside 18th june's candle & its about to break out of it on daily/hourly charts wih good OI & positive cross overs in 3 other indicators.
Could b bought above 854.50 with stoploss of 813 & target of 950
Risk:Reward = 1:2
Bu

Triangle Indise RangeIndusind Fut break out of triangle pattern inside range on an hourly charts with decent OI addition suggesting long build up after 7 sessions of consolidation inside range.
Could be bought with mentioned stoploss & target.

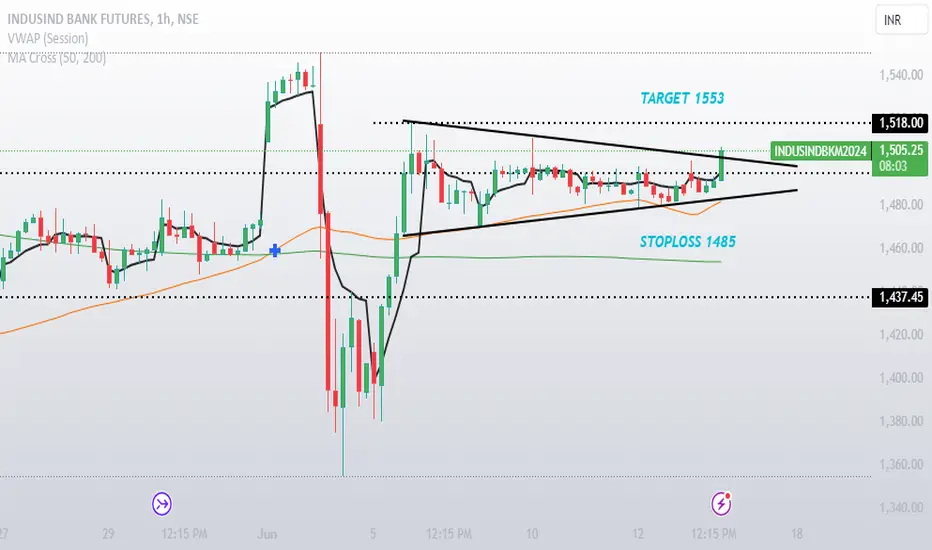
RUKEGA NAHIIIIINDUSIND broke out of classic triangle pattern on an hourly chart with decent OI.
Risk:-Reward = 1:3
Could b bought with mentioned stoploss & target.

INDUSINDBANKINDUSIND bank fut broke out of triangle pattern on an hourly chart with good OI build up.
Risk:Reward = 1:3
Could be bought with mentioned stoploss & target.
Short Term BullishEntry level 935 to 950
First target - 1050
Second Target- 1095
Lot Size - 900
Stop loss -

STOCK OF THE WEEK!TOP DOWN APPROACH:
Market : NIFTY is Bullish
Sector : BANKNIFTY
Stocks: INDUSIND BANK
Rationale : Major Breakout of the resistance zone and Bank nifty been a super bullish .
This stock has higher probability to move their prices to higher zone level of Rs 1400-1500 in coming days.

INDUSINDBANK CHART30 Minute ChartINDUSINDBANK CHART30 Minute Chart
What You See In This Chart?
How to take Trade?
Which Type Take Entry (Long / Short)?
Which Price For StopLoss?
Which Price For Target?
Please Comment What You Think About INDUSINDBANK Trade!!!!!
Disclaimer :- This Chart For Only Educational Purpose, We Can't Gi

INDSINDBANK CAN SELL IF YOU SEE REJECTIONS FROM THE ENTRY POINTDO CHECKOUT THIS STOCK FOR PROFITABLE TRADE

Indusind Bank is in the verge of a break out Buy Indus ind bank future Near 630-636 Tgt 660/680/700 SL 620
Disclaimer : This is for educational purpose.Before investing & trading take decisions from ur financial advisor.

See all ideas
Summarizing what the indicators are suggesting.
Neutral
SellBuy
Strong sellStrong buy
Strong sellSellNeutralBuyStrong buy
Neutral
SellBuy
Strong sellStrong buy
Strong sellSellNeutralBuyStrong buy
Neutral
SellBuy
Strong sellStrong buy
Strong sellSellNeutralBuyStrong buy
A representation of what an asset is worth today and what the market thinks it will be worth in the future.
Displays a symbol's price movements over previous years to identify recurring trends.
Frequently Asked Questions
The current price of INDUSIND BANK FUTURES is 783.65 INR — it has risen 0.05% in the past 24 hours. Watch INDUSIND BANK FUTURES price in more detail on the chart.
The volume of INDUSIND BANK FUTURES is 3.66 M. Track more important stats on the INDUSIND BANK FUTURES chart.
Open interest is the number of contracts held by traders in active positions — they're not closed or expired. For INDUSIND BANK FUTURES this number is 52.28 M. You can use it to track a prevailing market trend and adjust your own strategy: declining open interest for INDUSIND BANK FUTURES shows that traders are closing their positions, which means a weakening trend.
Buying or selling futures contracts depends on many factors: season, underlying commodity, your own trading strategy. So mostly it's up to you, but if you look for some certain calculations to take into account, you can study technical analysis for INDUSIND BANK FUTURES. Today its technical rating is strong sell, but remember that market conditions change all the time, so it's always crucial to do your own research. See more of INDUSIND BANK FUTURES technicals for a more comprehensive analysis.