Stock Analysis: INFIBEAM💹 Stock Analysis: INFIBEAM 💹
🔍 Key Levels to Watch:
📈 Buy Above: ₹29.70
📉 Sell Target: ₹52
📊 The stock has been consolidating in a descending wedge pattern. A breakout above ₹29.70 could signal a potential upward trend, with a target of ₹52 for profit booking. Watch for strong volume to confirm th
Next report date
—
Report period
—
EPS estimate
—
Revenue estimate
—
0.75 INR
2.25 B INR
39.93 B INR
1.71 B
About INFIBEAM AVENUES LTD
Sector
Website
Headquarters
Gandhinagar
Founded
2007
ISIN
INE483S01020
FIGI
BBG009JCWDF3
Infibeam Avenues Ltd. is a holding company, which engages in the provision of e-commerce and payment solutions to businesses of all sizes and the government. It operates through the Payment Business and E-Commerce Platform Business segments. The Payment Business segment includes Payment Gateway business with CC Avenue business brand and payment infrastructure including CPGS towards banks, and Credit & Lending related business. The E-Commerce Platform Business segment is involved in Software Framework & Infrastructure. The company was founded by Vishal Mehta and Vishwas Patel on September 01, 2007, and is headquartered in Gandhinagar, India.
Related stocks

INFIBEAM AVENUESNeed a Daily Candle Close above 33.2 , resistance on daily chart
For a swing or positional


INFIBEAM AVENUES 1MONTHNICE SYMETRIC TRIANGLE PATTREN IS OBSERVED.
.
.
.
.
.
.
I Am Not SEBI Registered Analyst. All Post and Levels Posting is only for educational and knowledge purpose. I Am not responsible for your any kind of loss or profit.
No Claim, All Rights Reserved.‼️
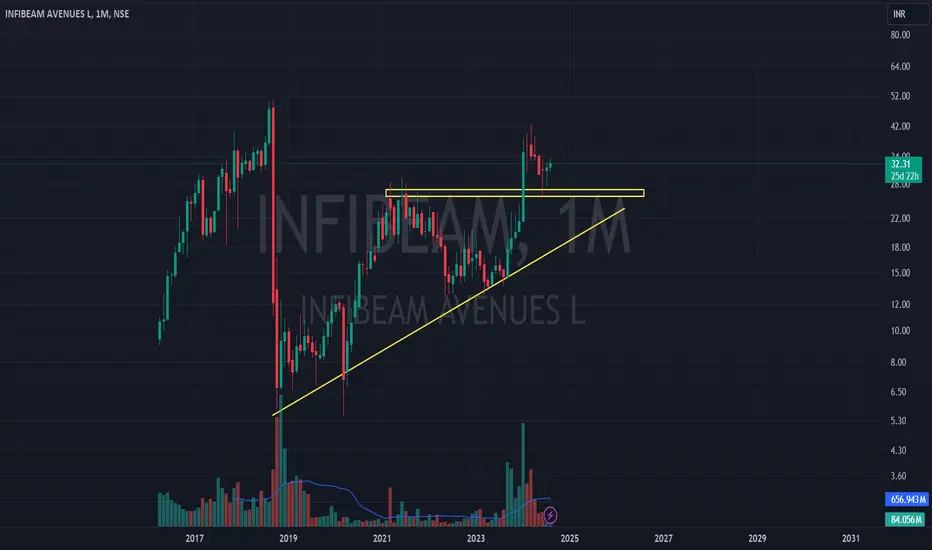
INFIBEAM - Consolidation rectangular box patternThis chart is only for educational purpose and this is not any recommendation for Buy and Sell. Do your own research before taking any positions

Hiden potentially Stock have huge potential
With volume and strength
Fundamentals are good but expenses are high ryt now beat the market


Infibeam PredictionNSE:INFIBEAM
Kindly note this is not a recommendation and is just my view on the scrip
Buy 19.50
Stop Loss - 16.10
Target 1 (Short Term) - 21.10
Target 2 (Short Term) - 28
Long Term Target - 78/123/168.36/196.15

INFIBEAM Long PositionalBuy INFIBEAM above 24.85
for the Target of 34.80-40.85-52.85
SL 16.15
Strategy : SBO + RSI < 60 + EMA above 20 & 50
Duration few Months

See all ideas
Summarizing what the indicators are suggesting.
Neutral
SellBuy
Strong sellStrong buy
Strong sellSellNeutralBuyStrong buy
Neutral
SellBuy
Strong sellStrong buy
Strong sellSellNeutralBuyStrong buy
Neutral
SellBuy
Strong sellStrong buy
Strong sellSellNeutralBuyStrong buy
An aggregate view of professional's ratings.
Neutral
SellBuy
Strong sellStrong buy
Strong sellSellNeutralBuyStrong buy
Neutral
SellBuy
Strong sellStrong buy
Strong sellSellNeutralBuyStrong buy
Neutral
SellBuy
Strong sellStrong buy
Strong sellSellNeutralBuyStrong buy
Displays a symbol's price movements over previous years to identify recurring trends.
Frequently Asked Questions
The current price of INFIBEAM is 16.05 INR — it has decreased by −0.93% in the past 24 hours. Watch INFIBEAM AVENUES LTD stock price performance more closely on the chart.
Depending on the exchange, the stock ticker may vary. For instance, on NSE exchange INFIBEAM AVENUES LTD stocks are traded under the ticker INFIBEAM.
INFIBEAM stock has fallen by −1.17% compared to the previous week, the month change is a −13.49% fall, over the last year INFIBEAM AVENUES LTD has showed a −34.09% decrease.
We've gathered analysts' opinions on INFIBEAM AVENUES LTD future price: according to them, INFIBEAM price has a max estimate of 21.46 INR and a min estimate of 21.46 INR. Watch INFIBEAM chart and read a more detailed INFIBEAM AVENUES LTD stock forecast: see what analysts think of INFIBEAM AVENUES LTD and suggest that you do with its stocks.
INFIBEAM reached its all-time high on Sep 18, 2018 with the price of 42.69 INR, and its all-time low was 4.64 INR and was reached on Mar 25, 2020. View more price dynamics on INFIBEAM chart.
See other stocks reaching their highest and lowest prices.
See other stocks reaching their highest and lowest prices.
INFIBEAM stock is 1.88% volatile and has beta coefficient of −5.08. Track INFIBEAM AVENUES LTD stock price on the chart and check out the list of the most volatile stocks — is INFIBEAM AVENUES LTD there?
Today INFIBEAM AVENUES LTD has the market capitalization of 55.72 B, it has decreased by −0.97% over the last week.
Yes, you can track INFIBEAM AVENUES LTD financials in yearly and quarterly reports right on TradingView.
INFIBEAM AVENUES LTD is going to release the next earnings report on Aug 12, 2025. Keep track of upcoming events with our Earnings Calendar.
INFIBEAM earnings for the last quarter are 0.20 INR per share, whereas the estimation was 0.09 INR resulting in a 123.69% surprise. The estimated earnings for the next quarter are 0.20 INR per share. See more details about INFIBEAM AVENUES LTD earnings.
INFIBEAM AVENUES LTD revenue for the last quarter amounts to 11.61 B INR, despite the estimated figure of 9.28 B INR. In the next quarter, revenue is expected to reach 9.79 B INR.
INFIBEAM net income for the last quarter is 491.00 M INR, while the quarter before that showed 624.00 M INR of net income which accounts for −21.31% change. Track more INFIBEAM AVENUES LTD financial stats to get the full picture.
Yes, INFIBEAM dividends are paid annually. The last dividend per share was 0.05 INR. As of today, Dividend Yield (TTM)% is 0.28%. Tracking INFIBEAM AVENUES LTD dividends might help you take more informed decisions.
EBITDA measures a company's operating performance, its growth signifies an improvement in the efficiency of a company. INFIBEAM AVENUES LTD EBITDA is 3.03 B INR, and current EBITDA margin is 7.60%. See more stats in INFIBEAM AVENUES LTD financial statements.
Like other stocks, INFIBEAM shares are traded on stock exchanges, e.g. Nasdaq, Nyse, Euronext, and the easiest way to buy them is through an online stock broker. To do this, you need to open an account and follow a broker's procedures, then start trading. You can trade INFIBEAM AVENUES LTD stock right from TradingView charts — choose your broker and connect to your account.
Investing in stocks requires a comprehensive research: you should carefully study all the available data, e.g. company's financials, related news, and its technical analysis. So INFIBEAM AVENUES LTD technincal analysis shows the sell today, and its 1 week rating is sell. Since market conditions are prone to changes, it's worth looking a bit further into the future — according to the 1 month rating INFIBEAM AVENUES LTD stock shows the sell signal. See more of INFIBEAM AVENUES LTD technicals for a more comprehensive analysis.
If you're still not sure, try looking for inspiration in our curated watchlists.
If you're still not sure, try looking for inspiration in our curated watchlists.