Stock Analysis: INFIBEAM💹 Stock Analysis: INFIBEAM 💹
🔍 Key Levels to Watch:
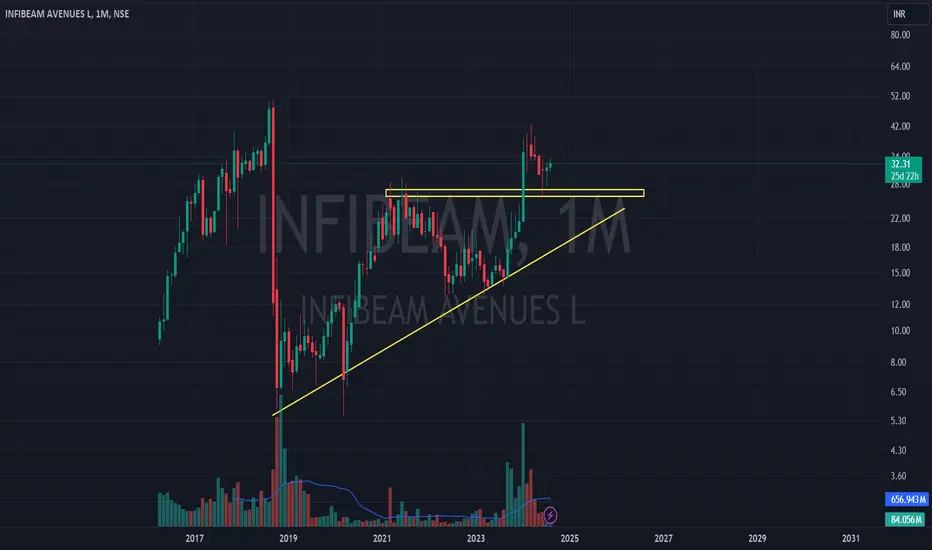
📈 Buy Above: ₹29.70
📉 Sell Target: ₹52
📊 The stock has been consolidating in a descending wedge pattern. A breakout above ₹29.70 could signal a potential upward trend, with a target of ₹52 for profit booking. Watch for strong volume to confirm the breakout!
💡 Trading Tip: Always use a stop-loss and consider overall market sentiment before entering trades.
🚀 Stay ahead in the market with expert insights!
Follow @investofino for more trading setups and strategies. 📈
#StockMarket #TradingTips #INFIBEAM #TechnicalAnalysis #InvestingMadeSimple #investofino
@investofino
INFIBEAM trade ideas

INFIBEAM AVENUESNeed a Daily Candle Close above 33.2 , resistance on daily chart
For a swing or positional


INFIBEAM AVENUES 1MONTHNICE SYMETRIC TRIANGLE PATTREN IS OBSERVED.
.
.
.
.
.
.
I Am Not SEBI Registered Analyst. All Post and Levels Posting is only for educational and knowledge purpose. I Am not responsible for your any kind of loss or profit.
No Claim, All Rights Reserved.‼️
INFIBEAM - Consolidation rectangular box patternThis chart is only for educational purpose and this is not any recommendation for Buy and Sell. Do your own research before taking any positions

Hiden potentially Stock have huge potential
With volume and strength
Fundamentals are good but expenses are high ryt now beat the market


Infibeam PredictionNSE:INFIBEAM
Kindly note this is not a recommendation and is just my view on the scrip
Buy 19.50
Stop Loss - 16.10
Target 1 (Short Term) - 21.10
Target 2 (Short Term) - 28
Long Term Target - 78/123/168.36/196.15

INFIBEAM Long PositionalBuy INFIBEAM above 24.85
for the Target of 34.80-40.85-52.85
SL 16.15
Strategy : SBO + RSI < 60 + EMA above 20 & 50
Duration few Months

INFIBEAM Infibeam is in pure strength and break it's 52wk high. Enter with a small stop loss and accumulate till 15-16 price.

INFIBEAMImpulse move expected.
1. ENTRY - 28.1
2. TARGET1 -34.5
3. TARGET 2 -39.5
Disclaimer :- Iam not SEBI registered adviser. Please research before Investing.

INFIBEAM MONTHLY CHARTINFIBEAM MONTHLY CHART
Ellipse breakout @ 29 MOB @ 57-60 Support @ 20
An ellipse breakout witnessed in this stock @ 29 levels. MOB active @ 57-60.
Its only an observation & not any suggestion or recommendation.

INFIBEAM Monthly Chart AnalysisINFIBEAM has given a strong breakout on monthly chart with strong volume spike . we can consider this stock at current market price 35 with sl of 25 .
Debt to Equity - 0.00
Company's median sales growth is 37.2% of last 10 years

£INFIBEAM 17 TGT 26 47% Buy Recommended - Rachit SethiaINFIBEAM 17.75
TARGET 26
SL 13
Return 47%
RR > 2
TF < 6 Months
Factors: BULLISH WEDGE BREAKOUT Trend Following Rising Volume with rising Prices. Flag pattern breakout. Pennant Pattern Breakout with Bullish Candle. Retest Successful. Higher Highs & Higher Lows. Broken above RESISTANCE levels Trading at SUPPORT levels Earnings are strong. Bullish Wedge Breakout Risk Return Ratio is healthy. And Rising from Double Bottom Pattern to Flag Pattern forming. If you like my work KINDLY LIKE SHARE & FOLLOW this page for free Stock Recommendations. With 💚 from Rachit Sethia

INFIBEAM Avenues L - An Overview As per previous chart history and technical analysis along with Fundamental inputs of the stock, it indicates that you can buy or hold your stock for profit in short term as per chart analysis.
Wait for reversal for better entry or Buy and Hold for big profit.
If broken downward, a big bearish trend is seen on the downside chart
All major points & downward levels mentioned on chart
Do your own research because I am not SEBI registered person and this is my personal opinion about this stock
Thanks for your support as always


Infibeam Avenues 8 year downtrend breakoutThis price action can be very big for this counter as it was in structural downtrend since its inception nearly 8 years ago.
Major observations include:
1) It is following a 900 day primary cycle. The 4th cycle started around 28th/Aug/2023 with a positive trend.
2) Breaks out of the 8 year downtrend.
3) Looks like first target will be Rs. 29-30. if the price breaks this level convincingly, we will have a confirmation on Primary Cycle breakout.

Wave 3 Initial Stage and Fibonacci Relationship.
In chart wave 1 and 2 are completed, and wave 3 initial stage begin. i have added fibonacci relationship method which is basis of Elliot wave theory. And also we see that there is double bottom patten at the bottom of wave 2. And there is a breakout at around 20. So as per fibonacci relationship guidelines we can estimate the length of third wave. which is related to wave one or 1.618 times the length of wave one.

#INFIBEAM LONG TRADE IDEA SETUPGreetings Folks,
today I have prepared a setup of INFIBEAM on NSE
the analysis is as follows-
- the price was in uptrend till now
- broke down a dynamic support but hold onto the support zone as mentioned
- now, if the price sustains to hold on this zone, the price may go as depicted, if not then trading will be cancelled
don't play with fire, always use a predefined stoploss

Strength Gaining Stock! #INFIBEAMStrength Gaining Stock!
Infibeam Avenues Ltd #INFIBEAM
1. Rising with Volume
2. Double Bottom Pattern
3. Rising from Volume Profile
Keep on your Watchlist.

#INFIBEAM LONG TRADE IDEA SETUPGreetings Folks,
today i have prepared a setup of INFIBEAM on NSE
the analysis is as follows
- price is in a good bullish rally
- dont root for deep retracements, join the herd early as possible
-we will not change our bias before the market shows some bearish structure
dont play with fire, always use a predefined stoploss

Small cap clean breakout infibeamLong breakout in infibeam.. keep sL below TL. Can be a multibagger over time.
