INFIBEAM AVENUES LTDINFIBEAM AVENUES LTD (1D)
CMP 17.60
- Made Insidebar.
- consolidating in Insidebar range.
- Once give Breakout and sustain above 19.05 will be UNSTOPPABLE.
Sector : Information Technology
Industry : Fintech
Smallcap
Mcap : 4,725.42 crores
PE : 33.30
About Company:
Infibeam Avenues is primarily engaged in business of software development services, maintenance, web development, payment gateway services, e-commerce and other ancillary services. Infibeam Avenues (IAL) is a leading digital payments and e-commerce technology platforms company in India and provides a comprehensive suite of web services spanning digital payment solutions, data centre infrastructure and software platforms. It provides solutions to merchants, enterprises, corporations and governments in both domestic as well as international markets to enable online commerce. Its digital technology facilitates businesses and governments to execute e- commerce transactions in a safe and secure manner.
INFIBEAM trade ideas

INFIBEAM SWING STOCK INFIBEAM SWING STOCK ... WAIT FOR LEVELS
DISCLAIMER
it's just my technical view. I'M NOT A SEBI REGISTERED ANALYST. Before taking trade or Invest consult your financial advisor.
✅Here we provide TECHNICAL Levels and Charts.💯
✅This channel is for educational and self analysis purposes only!

INFIBEAM AVENUESINFIBEAM AVENUES looks technically bullish for short term.
Stock is currently trading above the 8,21,65 & 200 EMA's.
Volume & RSI show bullishness for short term.
Entry - 18(look for dip)
Target - 20.60/22.25/23.90
SL- 16.70
Not that fundamentally strong stock. Trade small positions.
Study the stock & Trade Responsibly.

Immediate BUY InfiBeamBullish stock of the week. Immediate BUY InfiBeam for the TGT of 58, SL 42. Share declare dividend as well Bonus share. So, its a win win situtation for the stock either BUY it or hold it.

Showing signs of breakout.Infibeam showing good signs of a breakout. 48.5 seems to be immediate resistance but if thats taken out it should be a free run from there.
Broke the 200 day ema as well.
On the one hour candle we are seeing a beautiful cup and handle as well, just confirming our theory of breakout in the making.
I took a small position now, plan to load more after it crosses 48.5.

H&S Breakdown can lead Infibeam lowerOn the daily charts, Infibeam had been showing some strength lately, with higher bottoms and higher tops, and looked all set to break above its recent highs of 58. But in the last 2 days, a sharp downtick has led to some negativity in the charts.
Infibeam has closed below its 20DMA and there seems to be a Head & Shoulders breakdown on the hourly charts. In case Infibeam is unable to sustain above this neckline, this breakdown can first test the 48-48.50 support and - if that gives away - then low 40s. If you're trading short on the basis of this H&S Breakdown, keep your SL above the breakdown candle.

Trend Line Support Stock Analysis: Infibeam has taken support from trend line it is good buy around breaking above supply zone with below demand zone as stop loss level for the target given on the chart for longterm.
Let'see..
Happy Investing!


Infibeam Bullish DivergenceInfibeam Avenues Limited is an Indian company that offers digital payments, e-commerce software and internet services. The company was founded in 2007 and is headquartered in Ahmedabad, India. In 2019, its consumer ecommerce website Infibeam.com was acquired by Suvidhaa Infoserve and now operates as Suvideals.ooo.
Infibeam has offices in Ahmedabad, Delhi, Mumbai and Bengaluru. The company became India's first E-commerce company to file an IPO, in July 2015.
Go Long for TGT 100+
Timeframe 3-6 month

Go long In INFIBEAM Stock:-Price is supported by high volume so uptrend will continue till volume is supporting it.
The Stock is also in oversold zone so lot of upward movement is still to come.
IF we look at chart pattern, we will find a beautiful uptrend in chart pattern .
So act accordingly, you can still go long in this stock


infibeam in descending triangle & H/S pattern infibeam in descending triangle & H/S pattern wait for breakout/down


INFIBEAM- SWING - LONG - 19.MAY.2020 (Falling on low volume)It seems that in the recent days price is rising with good volume and it is falling on low volume.
Now the current pullback also follows the same.
The entry could be any close above the previous days high if the volume is rising compared to the previous day.
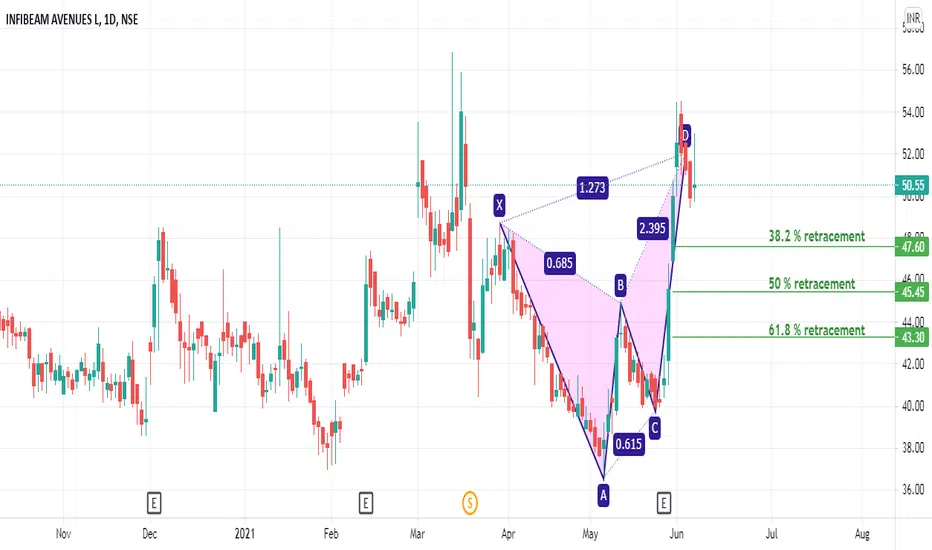
Target could be previous swing high which is around 56.


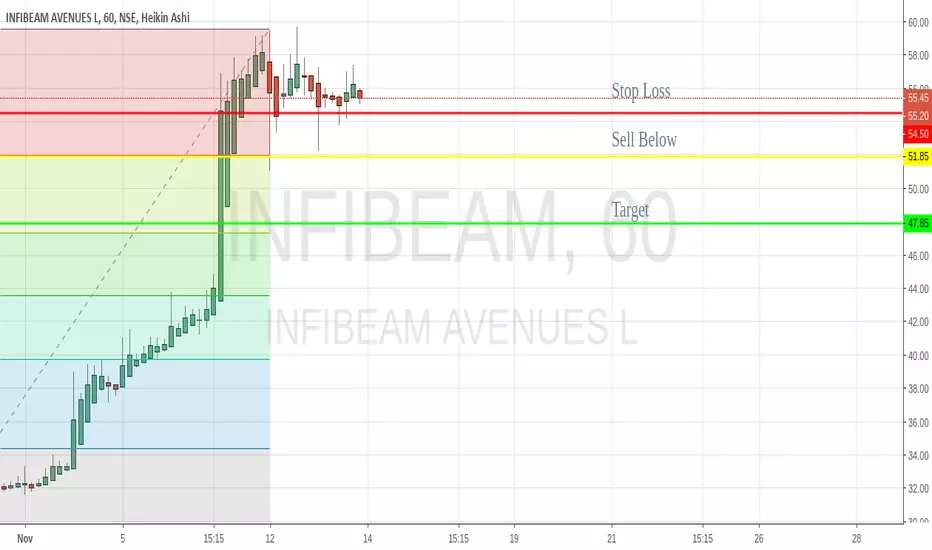
NSE:INFIBEAM Sell For 14 Nov 2018NSE:INFIBEAM sell initiate for 14 Nov 2018 using 1 hour chart based on Fibonacci levels,
check below Sell level :
Sell Below : 51.85
Stop Loss : 55.2
Target : 47.85
INFIBEAM - Intraday Earnings Long StraddleEarnings tomorrow after market close, likely to be heavily negative. I intend to enter the trade late towards the market close to minimize theta.
A major risk here is the theta since the lot size is massive.
