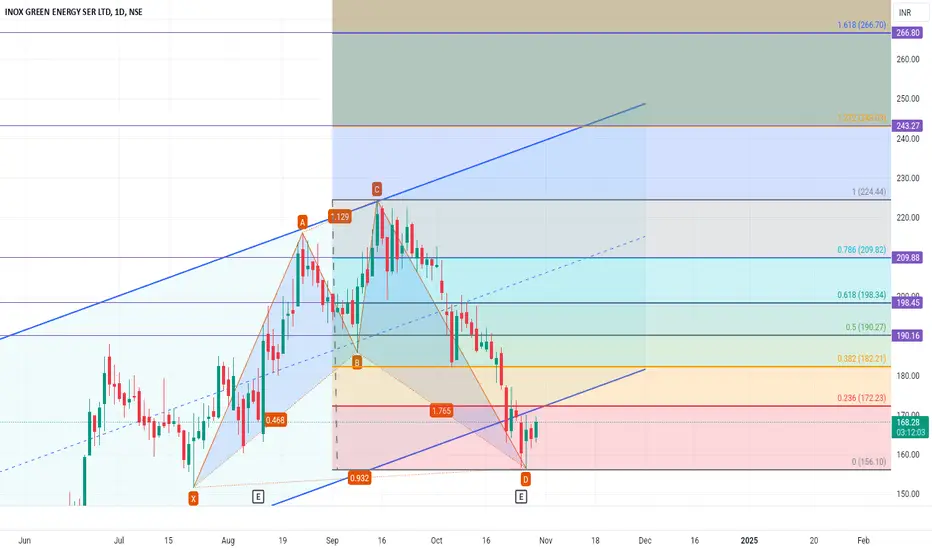
Inox Green - Forming Shark Turning to bullishInox Green has formed Bullish shark pattern.
At 0.5 fib level - 190 level it has crucial zone.
Candle close above 190 - 195 will confirm for next levels.
Target1: 198 to 210
Target2: 243 to 267
INOXGREEN trade ideas
INOX GREEN ENERGY SER LTD S/RSupport and Resistance Levels:
Support Levels: These are price points (green line/shade) where a downward trend may be halted due to a concentration of buying interest. Imagine them as a safety net where buyers step in, preventing further decline.
Resistance Levels: Conversely, resistance levels (red line/shade) are where upward trends might stall due to increased selling interest. They act like a ceiling where sellers come in to push prices down.
Breakouts:
Bullish Breakout: When the price moves above resistance, it often indicates strong buying interest and the potential for a continued uptrend. Traders may view this as a signal to buy or hold.
Bearish Breakout: When the price falls below support, it can signal strong selling interest and the potential for a continued downtrend. Traders might see this as a cue to sell or avoid buying.
MA Ribbon (EMA 20, EMA 50, EMA 100, EMA 200) :
Above EMA: If the stock price is above the EMA, it suggests a potential uptrend or bullish momentum.
Below EMA: If the stock price is below the EMA, it indicates a potential downtrend or bearish momentum.
Trendline: A trendline is a straight line drawn on a chart to represent the general direction of a data point set.
Uptrend Line: Drawn by connecting the lows in an upward trend. Indicates that the price is moving higher over time. Acts as a support level, where prices tend to bounce upward.
Downtrend Line: Drawn by connecting the highs in a downward trend. Indicates that the price is moving lower over time. It acts as a resistance level, where prices tend to drop.
Disclaimer:
I am not a SEBI registered. The information provided here is for learning purposes only and should not be interpreted as financial advice. Consider the broader market context and consult with a qualified financial advisor before making investment decisions.

Inox green looking clean. Inox Green Energy Services Ltd. provides wind power operation and maintenance services. The company is engaged in the business of providing long-term O&M services for wind farm projects,
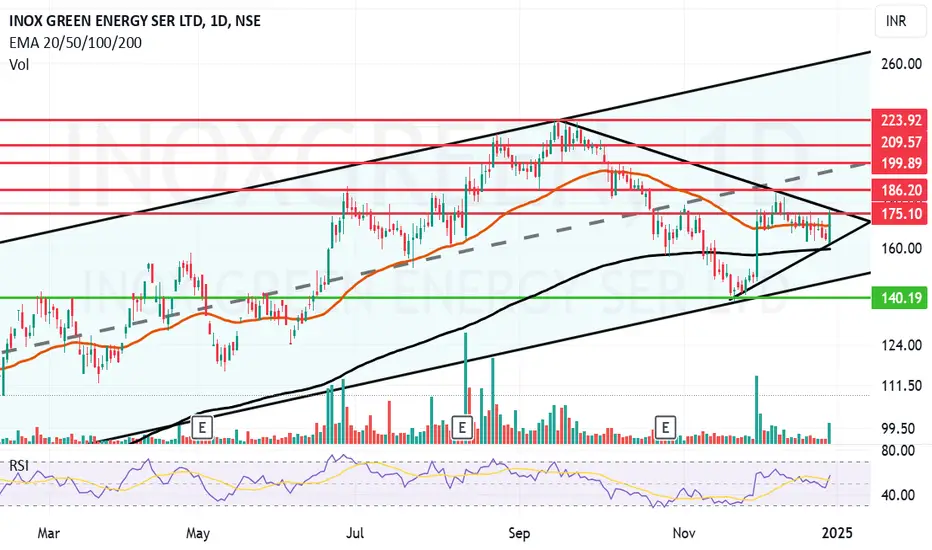
Inox Green Energy Services Ltd. CMP is 175.19. The positive aspects of the company are Company with Low Debt, Company able to generate Net Cash - Improving Net Cash Flow for last 2 years, Company with decreasing Promoter pledge, Annual Profit Growth higher than Sector Profit Growth and Negative to Positive growth in Sales and Profit. The Negative aspects of the company are extremely Highest Valuation (P.E. = 214.8) and Increasing Trend in Non-Core Income.
Entry can be taken after closing above 176 Targets in the stock will be 186 and 199. The long-term target in the stock will be 209 and 223. Stop loss in the stock should be maintained at Closing below 159 or 140 depending upon your risk taking ability.
Disclaimer: The above information is provided for educational purpose, analysis and paper trading only. Please don't treat this as a buy or sell recommendation for the stock. We do not guarantee any success in highly volatile market or otherwise. Stock market investment is subject to market risks which include global and regional risks. We will not be responsible for any Profit or loss that may occur due to any financial decision taken based on any data provided in this message.
Inox Green: Pull and golden crossover Inox Green: Pull and golden crossover
Target 226
Sl around 3%
Stricltly for educational purpose

INOXGREEN : Precision Trade Setup with Dual ScenariosINOX GREEN LIMITED 📊
1. Key Levels
Deep Retracement Zone (₹142-132):
This zone represents the 113-127% retracement, often considered a hotspot for institutional buying.
Price stabilization is likely due to the combination of technical demand and psychological support levels.
Stop Loss (₹126-121):
Failure to sustain above this zone invalidates the demand setup and signals further downside momentum.
Targets:
First Target (₹180-185): Marks the Change of Character (ChoCH), indicating potential trend reversal.
Second Target (₹200-206): A significant resistance zone, where selling pressure might emerge due to extended retracement.
2. Trade Setup
A. Long Trade Setup:
Why Long?
The market is completing a Wave 5 structure near the demand zone.
Reversals frequently occur here, often accompanied by signs of downtrend exhaustion.
Entry: Near ₹132-127, after confirming bullish candlesticks or rising volumes.
Stop Loss: Below ₹121, to minimize risk if the demand zone fails.
Targets:
₹180-185: A breakout here confirms buyers are regaining control.
₹200-206: Extended retracement zone where resistance may develop.
B. Short Trade Setup (If Demand Fails):
Why Short?
A breakdown below ₹121 confirms the demand zone failure, signaling further downside momentum.
Entry: Below ₹121, after a confirmed breakdown.
Targets:
₹100-90: The next significant support levels.
Stop Loss: Above ₹127, to protect against losses if the price reclaims the broken demand zone.
3. Confirmation Signals
Bullish Reversal Indicators for Long Entry:
Candlestick patterns (e.g., hammer, bullish engulfing) near ₹127-132.
Volume spikes during upward moves suggest institutional buying activity.
Break of Structure (BoS) above ₹150 confirms a bullish trend reversal.
Bearish Breakdown Indicators for Short Entry:
Price closes below ₹121 with high volume, confirming demand failure.
4. Risk Management
Why Manage Risk?
Reversals or breakdowns may fail; a predefined Stop Loss limits potential losses.
Risk-to-Reward Ratio (R:R):
Maintain a minimum R:R ratio of 1:2 for favorable trade setups.
Position Sizing:
Limit exposure to 1-2% of your total capital per trade to manage risk effectively.
Why This Plan Works
Elliott Wave Alignment: The chart indicates the completion of a bearish Wave 5 structure near a demand zone, signaling a reversal opportunity.
Retracement Zone Logic: The 113-127% retracement zone is a proven technical area for trend reversals or continuation patterns.
Clear Confirmation Criteria: Waiting for volume spikes, candlestick patterns, and BoS ensures higher probability entries.
Disclaimer:
I am not a SEBI-registered analyst. This trading plan is for educational purposes only. Please do your research or consult with a financial advisor before trading.

Go long in INOX GREENThere is a trendline breakout in stock. If it manages to close above 173 on daily frame. From there, we can expect targets of 177,184,192,204 on the up side. keep investing in this stock.
Stoploss for this investment can be placed near 140.

INOXGREEN - Bullish oNStock name - Inox Green Energy Services Limited.
✅#INOXGREEN
✅Next resistance 328
✅Moved 20% in 9 weeks.
Weekly chart
Chart is self explanatory everything.
Master score - B
Disclaimer : This is for demonstration and education purpose only. This is not buying and selling recommendation. I'm not SEBI registered.

Inox Green LongInox Green has started to move out from a parallel channel forming a flag pattern. There is a breakout and possible target of 240.

INOXINDIA - BULLISH SetupStock name - Inox Green Energy Services Limited.
Weekly chart setup
Chart is self explanatory. Levels of breakout, possible up-moves (where stock may find resistances) and support (close below which, setup will be invalidated) are clearly defined.
Master Score - B
Disclaimer: This is for demonstration and educational purpose only. this is not buying and selling recommendations. I am not SEBI registered. please consult your financial advisor before taking any trade.

Inox Green Energy Services Ltd.*Inox Green Energy Services Ltd.*
P&F Formation on Monthly Basis.
Strong Price BreakOut & Sustained.
Strong Vol Consolidation. Gaining Traction.
Sector Outlook Highly Positive.
*Trail SL with Upside*
*Book Profit as per Risk Appetite*
*Do Your Own Research as well. This is an Opinion.*
*_Happy Investing_*

Inox green breaking out of consollidation??Inox green breaking out of consollidation??
buy above 154
SL 146
target 170, 190, 200
target percentage 15,20 %
I am not sebi registered broker.
do you due delligance before investing/trading

INOX WIND Weekly, dailySymmetrical triangle on weekly
Daily consolidation breakout
chart looks promising
long term up trend

INOXGREENBreakout happend in this stock.
Keep your risk and reward ratios according to your own preferances.
This is for educational purpose, do your own research before investing.

INOX GREENINOX GREEN (1D)
CMP 64.40
after consolidating at near All time high given Breakout
Can continue it's Breakout move

Inox Green Energy Services LtdAfter three black crows a strong
bullish engulfing candle formed
with 6% rally today

luking gud for Swing tradingInox green luks gud in price action.
Gives breakout from downtrend channel after that its retest their support line.
CMP 69.75
trget atleast 1:3
Stoploss below the trendline.

Inox green 💚 TARGET 90₹Clearly breakout seen in the chart ,and last few days volume is high it can bee touch 90 ₹ as per chart
Please watch on it
Disclaimer:
I am not sebi registered person, please invest in your own risk and counsut your financial advisor before investing
Thank you very much!!!💫

INOXGREEN - Weekly Chart AnalysisAs weekly chart have not much data. Let's dive into the daily timeframe and see the priceaction. The price had a nice contraction in volumes and tight consolidation just below the resistance and it brokeout with nice volumes and now we have to either wait for a pullback to the resistance which shall now act as a support.
Disclaimer: This is just an analysis and not a buy or sell recommendation. If you intend to trade this counter then do your own due diligence and trade at your own risk.

Inox Green Energy Service-Nice BreakoutInox Green Energy Service-Nice Breakout
Capital to be deployed- 20k
Investing Price -62-64
Breakout Price -60
Stoploss -50.65
Targets -118-154
#inox #StocksInFocus #StocksToBuy #stockstowatch #stocks #StocksToTrade #SwingTrading #BREAKOUTSTOCKS

INOXGREENlOOKS good for upmove
Can make a base breakout for the candle and the trend can continue.
Only for educational purpose.
Not a trade recommendation.

#inoxgreen #inoxgreen
expecting sharp upmove
buy above 57 for target 62
can see more upmove after 65
#ipobreakout
